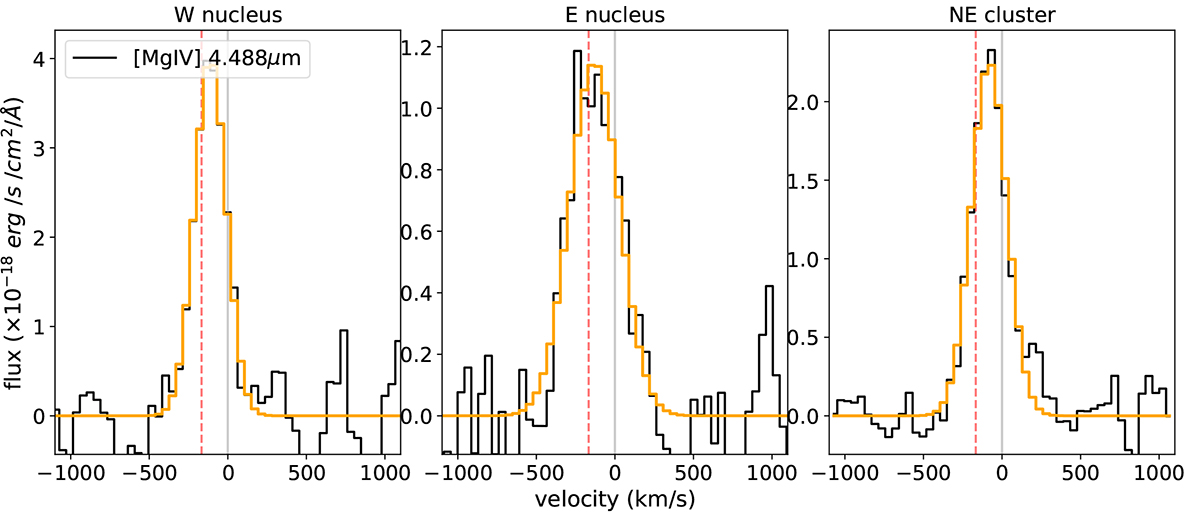
Fig. 5.
Download original image
Continuum-subtracted integrated spectra of the three regions of interest in the vicinity of the [Mg IV] 4.488 μm. The original spectra (in black) are reported in velocity space. The best-fit emission line profiles are shown in orange. Broad and blueshifted profiles are found in the E nuclear spectrum. The vertical grey lines mark the zero-velocity as inferred from the narrow component of the H I lines, and the dashed red lines mark the expected position of the S I line.
Current usage metrics show cumulative count of Article Views (full-text article views including HTML views, PDF and ePub downloads, according to the available data) and Abstracts Views on Vision4Press platform.
Data correspond to usage on the plateform after 2015. The current usage metrics is available 48-96 hours after online publication and is updated daily on week days.
Initial download of the metrics may take a while.