Fig. 4.
Download original image
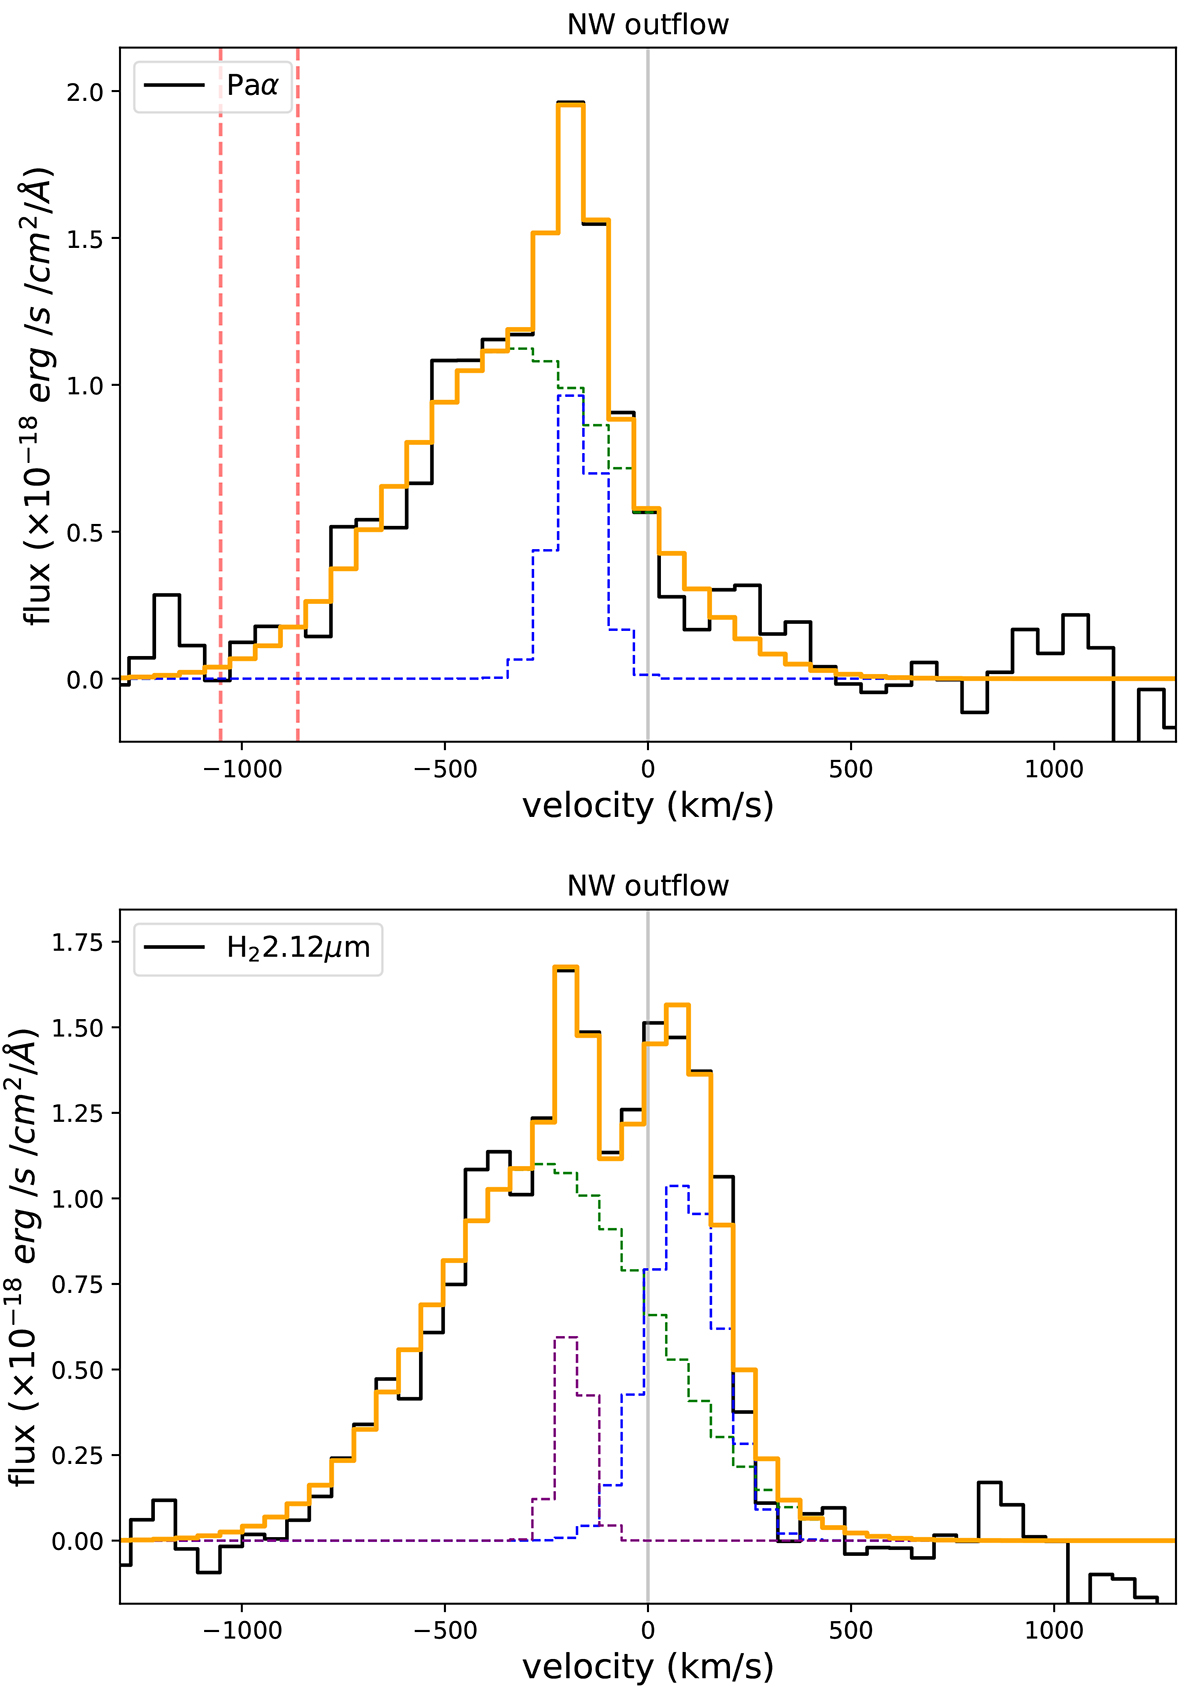
Observed profiles of Paα and H2 2.12 μm, showing fast outflows. The spectra are extracted from the region in Fig. 1 marked with a cyan diamond, and they are reported in velocity space. The best-fit emission line profiles are shown in orange, and the individual Gaussian profiles used to reproduce the line shapes are reported in blue, purple, and green. The vertical grey lines mark the zero-velocity of the E nucleus, which is the most likely origin of the outflow shown in the figure (see the detailed discussion in Perna et al. 2020; Ulivi et al. 2024), and the dashed red vertical lines in the top panel identify the He I lines close to Paα (see Table C.1).
Current usage metrics show cumulative count of Article Views (full-text article views including HTML views, PDF and ePub downloads, according to the available data) and Abstracts Views on Vision4Press platform.
Data correspond to usage on the plateform after 2015. The current usage metrics is available 48-96 hours after online publication and is updated daily on week days.
Initial download of the metrics may take a while.