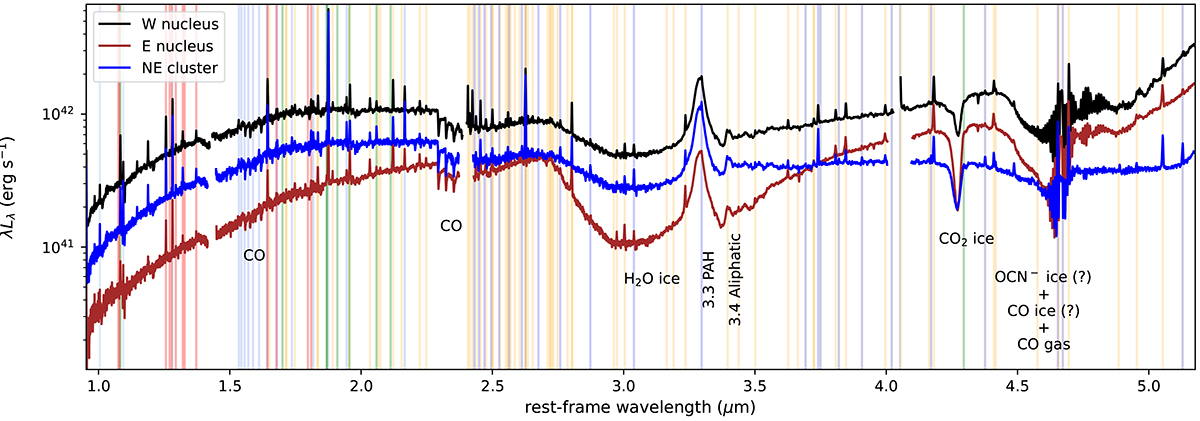
Fig. 2.
Download original image
Arp 220 NE cluster, W and E nuclear spectra from the three NIRSpec gratings. The spectra are shown in luminosity as a function of the rest frame wavelength. The vertical blue lines mark the positions of hydrogen transitions (dark to light blue indicate distinct hydrogen series). The orange lines identify H2 lines, the red lines are associated with [Fe II] transitions, and the green lines mark He I emission features. Strong broad-band absorption and emission features are also labelled in the figure. Zoom-in plots are presented in Appendix B.
Current usage metrics show cumulative count of Article Views (full-text article views including HTML views, PDF and ePub downloads, according to the available data) and Abstracts Views on Vision4Press platform.
Data correspond to usage on the plateform after 2015. The current usage metrics is available 48-96 hours after online publication and is updated daily on week days.
Initial download of the metrics may take a while.