Fig. B.6.
Download original image
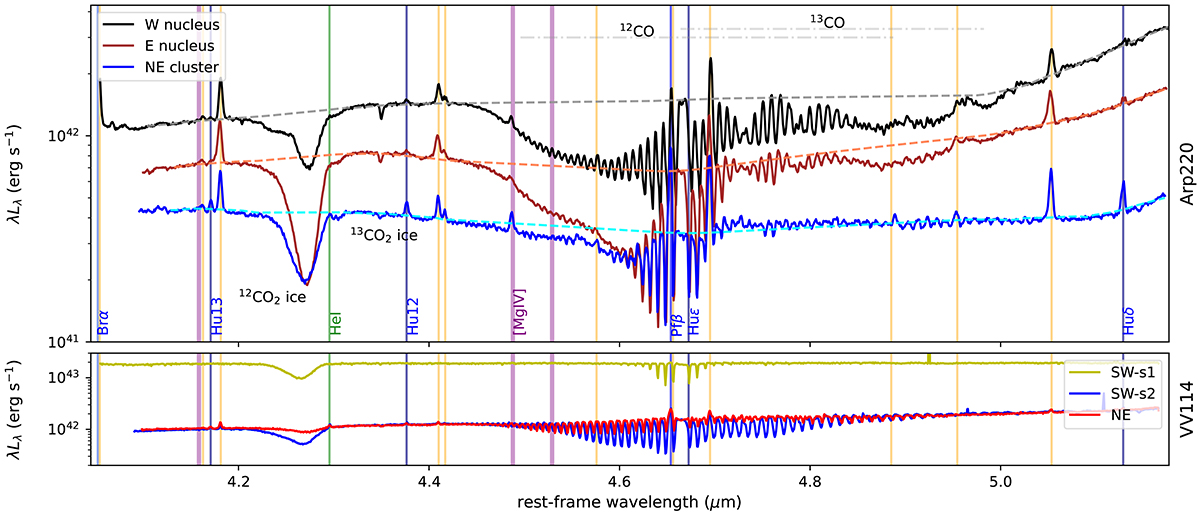
4.1 − 5.2 μm portion on the spectra of Arp 220 and VV114 nuclear regions. The E and W nuclei show 12CO ro-vibrational lines up to Jlow = 23 (i.e. within the wavelength range marked with a dot-dashed horizontal line; for completeness, 13CO range is also reported, similar to Fig. 2 in González-Alfonso et al. 2024). Detailed modelling of the CO transitions will be presented in Buiten et al., in prep. See B.1 for further details.
Current usage metrics show cumulative count of Article Views (full-text article views including HTML views, PDF and ePub downloads, according to the available data) and Abstracts Views on Vision4Press platform.
Data correspond to usage on the plateform after 2015. The current usage metrics is available 48-96 hours after online publication and is updated daily on week days.
Initial download of the metrics may take a while.