Fig. 7
Download original image
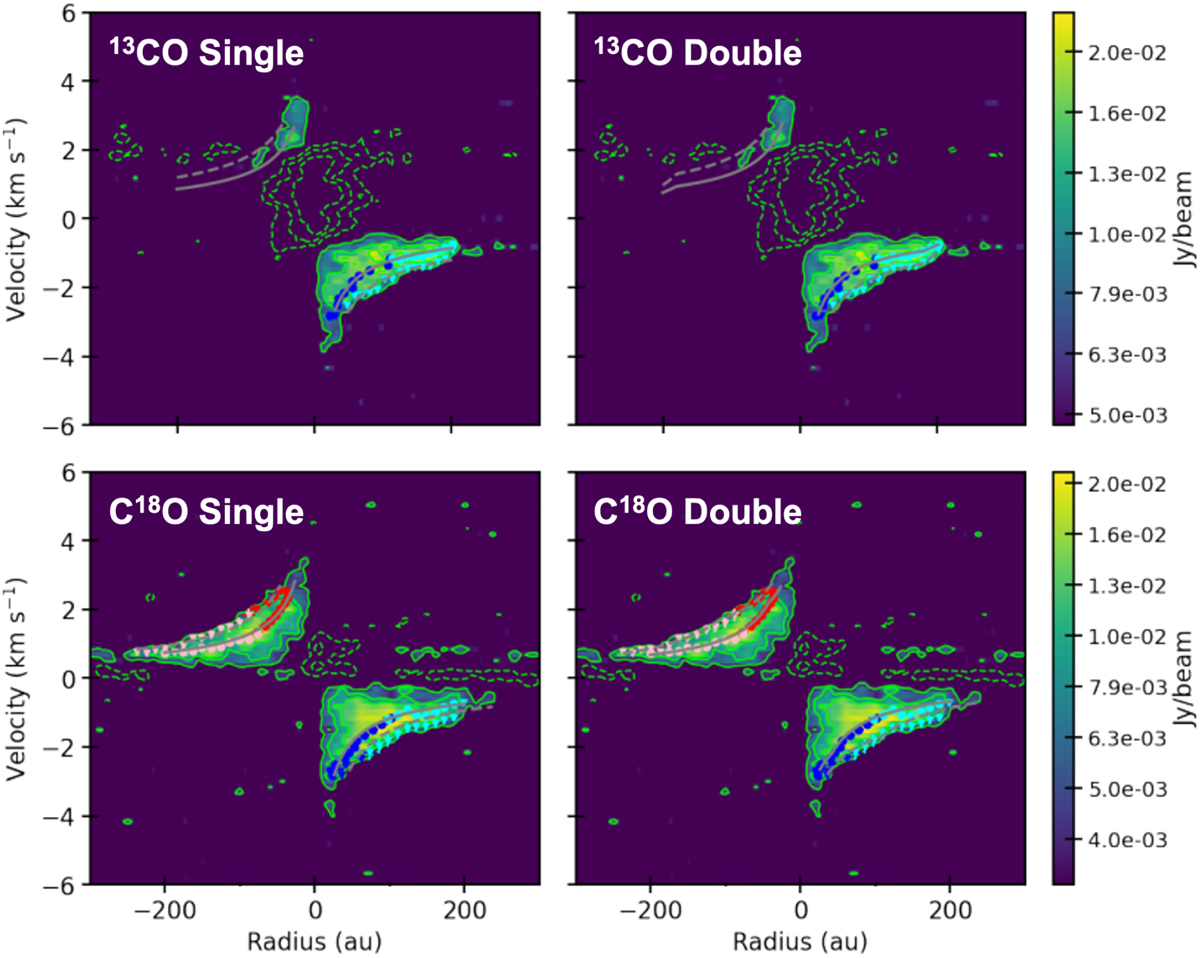
13CO (2−1) and C18O (2−1) position velocity diagrams. The top panel show 13CO (2−1) and the bottom panels show C18O (2−1). All the diagrams were obtained along the disk major axis with a position angle of 109 degrees (estimated from the 2D Gaussian fitting) and a width of 0/17. The circles represent the ridge component, and the triangles show the edge component using SLAM. The solid and dashed curves represent fitting results obtained with the ridge and edge methods, respectively. The different colors show data points obtained along different directions. The cyan and magenta points represent data points obtained along the velocity axis, and blue and red show data points obtained along the position axis. The lime contours mark the emission at 3, 6, and 9 times the rms given in Table 2. Further details of the fitting procedure can be found in Aso & Sai (2023). The left column shows the single power-law fit, and the right column shows the double power law fit.
Current usage metrics show cumulative count of Article Views (full-text article views including HTML views, PDF and ePub downloads, according to the available data) and Abstracts Views on Vision4Press platform.
Data correspond to usage on the plateform after 2015. The current usage metrics is available 48-96 hours after online publication and is updated daily on week days.
Initial download of the metrics may take a while.