Fig. 6
Download original image
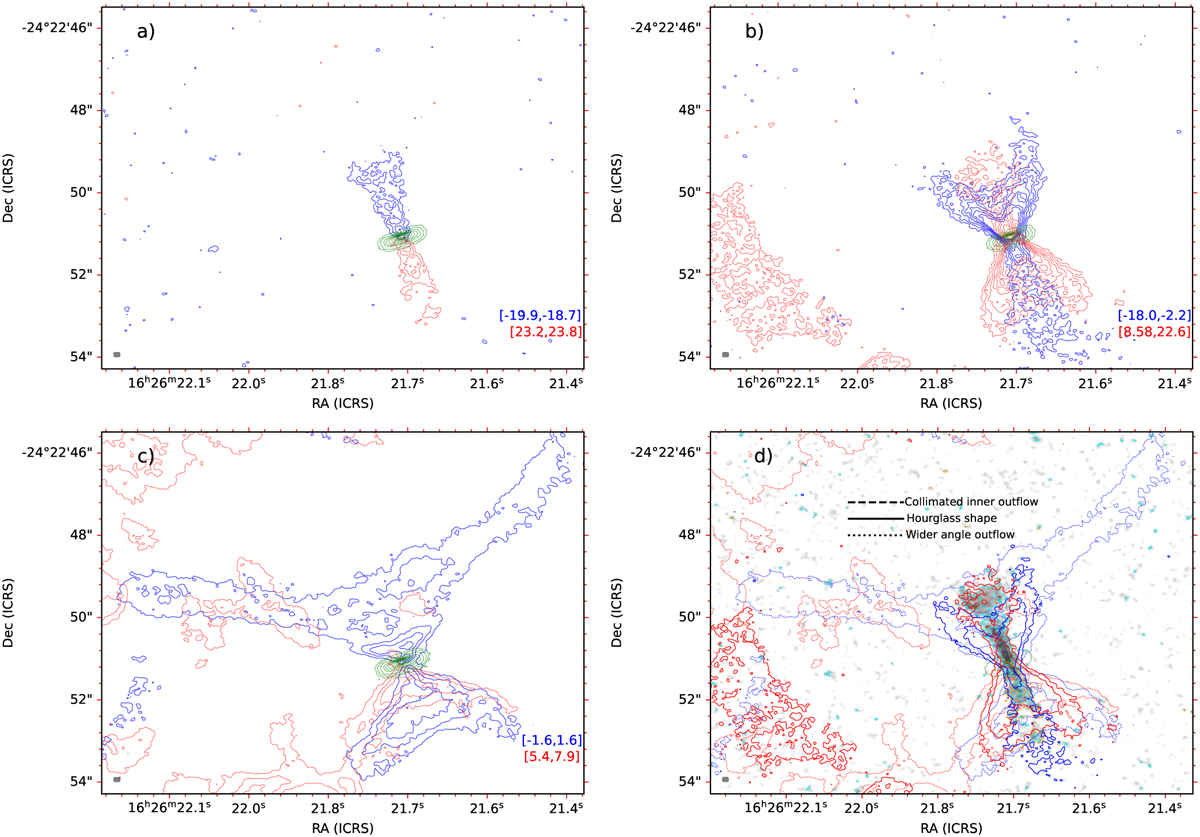
12CO (2–1) integrated emission maps (moment zero) at different velocity stages toward GSS30 IRS3. The green contours represent the dust disk in all the images. The blue contours show blueshifted emission and the red contours show redshifted emission. Panels (a–c) show 3, 5, 7, 9, 11, 13, and 15 times the rms of the respective moment 0 map. (a) Image of the inner high-velocity and narrow outflow component. (b) Close-up image of the hourglass-shape intermediate-velocity component of the molecular outflow. (c) Outer wide-angle low-velocity outflow emission. (d) Combination of panels (a) (dashed with orange and cyan colors), (b) solid, and (c) dotted using 3 and 7 times the rms. The gray image represents the inner high-velocity and narrow outflow. The local standard of rest velocity of the cloud is ∼2.84 km s–1.
Current usage metrics show cumulative count of Article Views (full-text article views including HTML views, PDF and ePub downloads, according to the available data) and Abstracts Views on Vision4Press platform.
Data correspond to usage on the plateform after 2015. The current usage metrics is available 48-96 hours after online publication and is updated daily on week days.
Initial download of the metrics may take a while.