Fig. B.1
Download original image
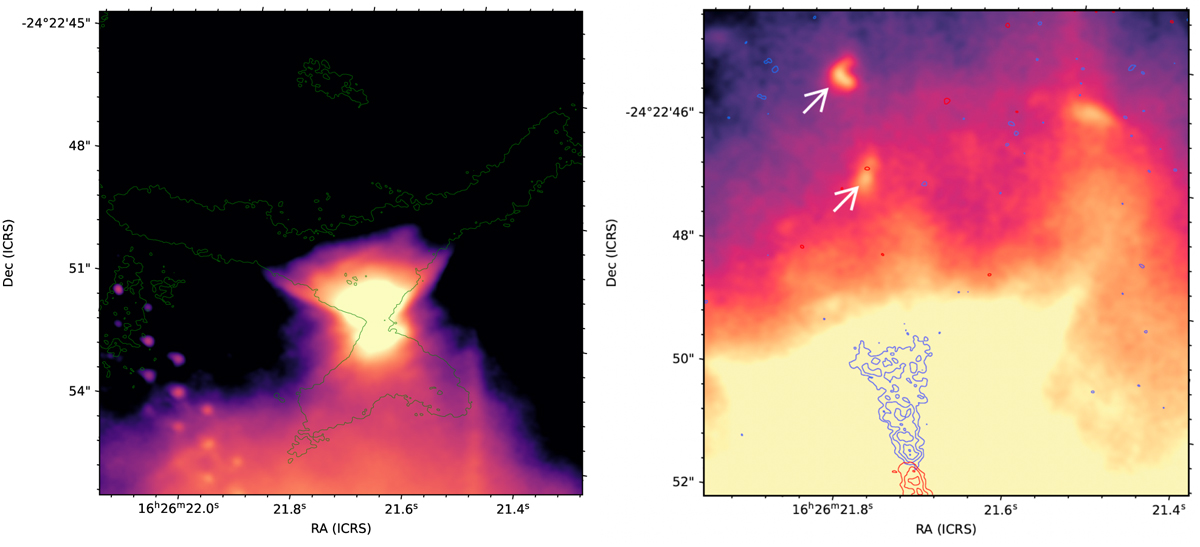
JWST molecular hydrogen color image (4.7 µm image with the F470N filter) over GSS30 IRS3 (12CO). Left panel shows the blueshifted component from the bottom-left panel of Fig. 6 with contours over 3 times the rms. Right panel only shows the collimated blueshifted and redshifted molecular outflow. Color image contrast limits are adjusted to enhance the presence of two knots in the direction of the blueshifted collimated molecular outflow emission which are pointed with two white arrows. The knots are located at 4″.9 and 6″.7 from the center of the continuum emission. Contours represent 3, 5, 7, 9, 11, 13 and 15 times the rms.
Current usage metrics show cumulative count of Article Views (full-text article views including HTML views, PDF and ePub downloads, according to the available data) and Abstracts Views on Vision4Press platform.
Data correspond to usage on the plateform after 2015. The current usage metrics is available 48-96 hours after online publication and is updated daily on week days.
Initial download of the metrics may take a while.