Fig. 5.
Download original image
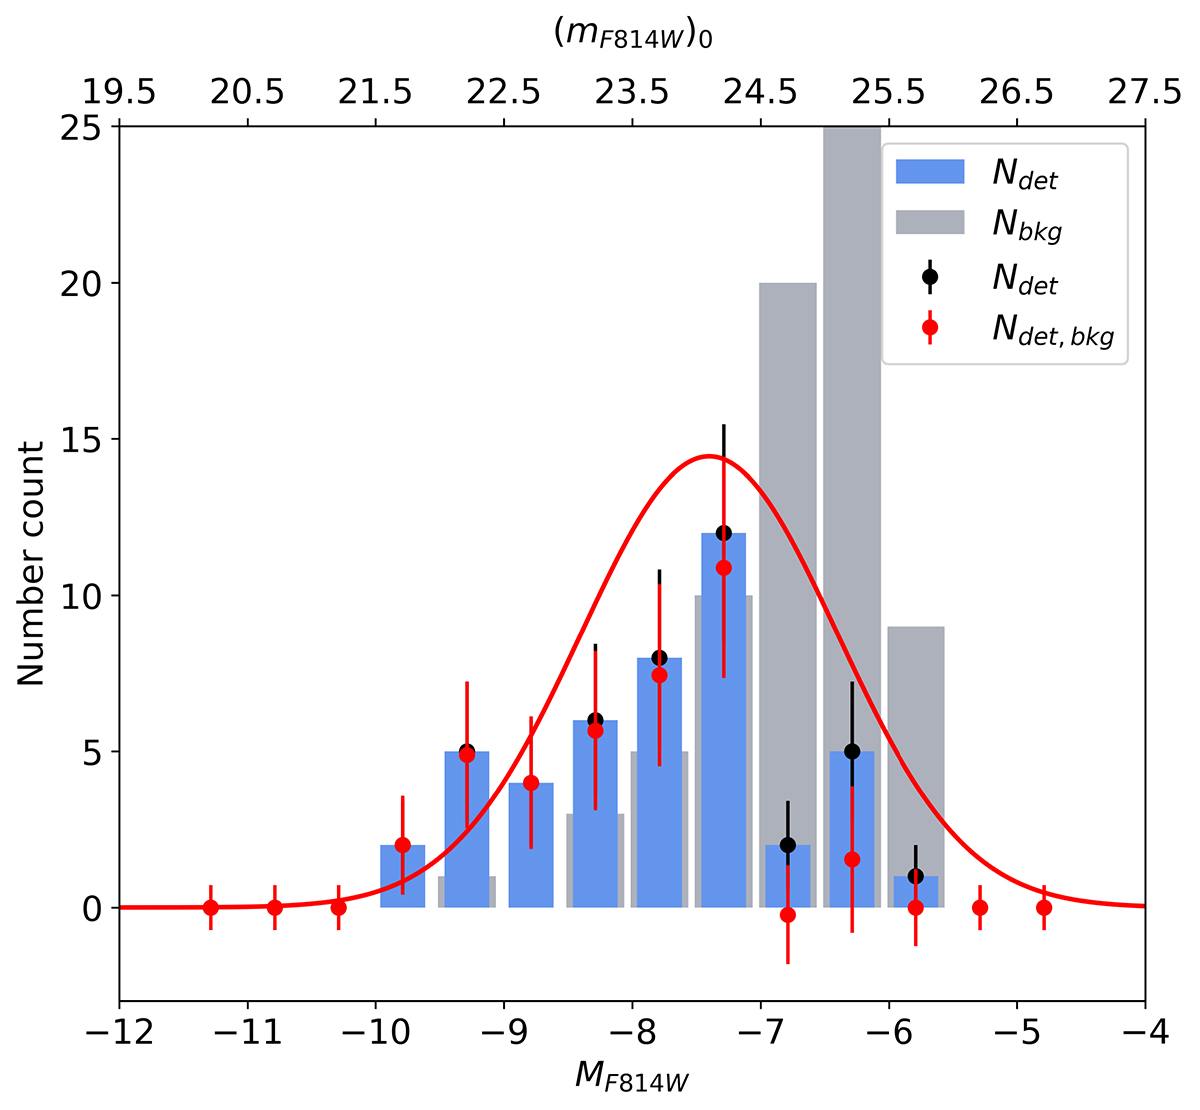
GCLF as a function of absolute magnitude MF814W (bottom) and apparent magnitude (mF814W)0 (top) of the detected GCs within 2Re (blue), and the detections outside 2Re (grey) for the UDG MATLAS-2019, which has the largest number of GCs in our sample. The black points are for the raw count within 2Re and the red points show the GC count after background subtraction. The red solid line shows the Gaussian fit with peak absolute magnitude MV = −7.3 mag and a dispersion of 1 mag.
Current usage metrics show cumulative count of Article Views (full-text article views including HTML views, PDF and ePub downloads, according to the available data) and Abstracts Views on Vision4Press platform.
Data correspond to usage on the plateform after 2015. The current usage metrics is available 48-96 hours after online publication and is updated daily on week days.
Initial download of the metrics may take a while.