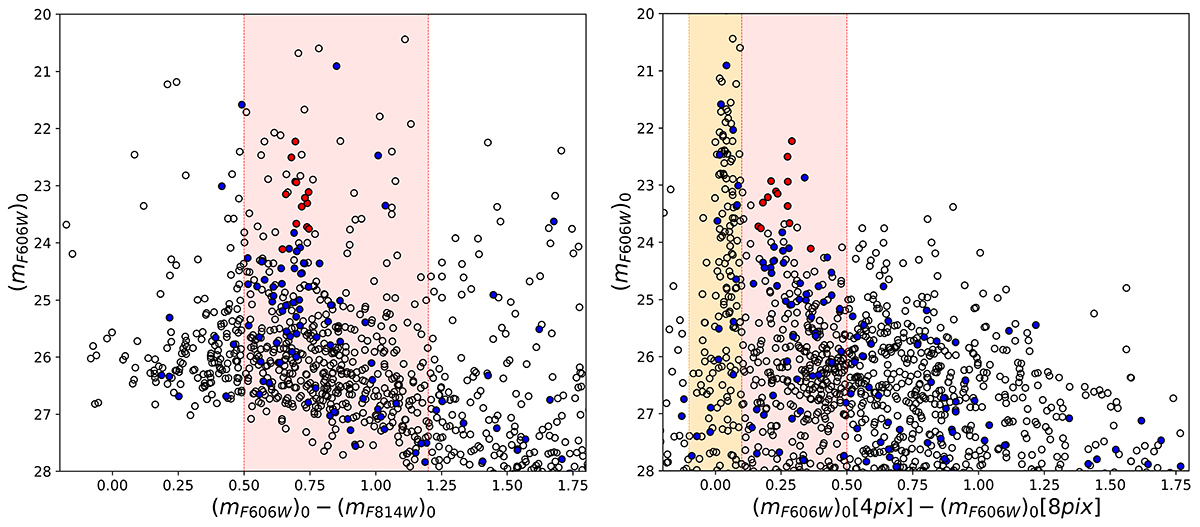
Fig. 3.
Download original image
Colour (left) and concentration index (right) cut of all GC detections (black open circles) and the GC detections within 2Re (blue circles), based on the spectroscopically confirmed GCs in MATLAS-2019 (red circles: Müller et al. 2021). The light red region highlights the selection cut we used for colour, 0.5 < (mF606W − F814W)0 < 1.2, and for the concentration index, 0.1 < Δm4 − 8 < 0.5, for galaxies with a distance ≤25 Mpc. For galaxies at larger distances, i.e., > 25 Mpc, the lower concentration index cut was extended to include the unresolved sources, highlighted by the light orange and light red regions, corresponding to a cut of −0.1 < Δm4 − 8 < 0.5.
Current usage metrics show cumulative count of Article Views (full-text article views including HTML views, PDF and ePub downloads, according to the available data) and Abstracts Views on Vision4Press platform.
Data correspond to usage on the plateform after 2015. The current usage metrics is available 48-96 hours after online publication and is updated daily on week days.
Initial download of the metrics may take a while.