Fig. 15.
Download original image
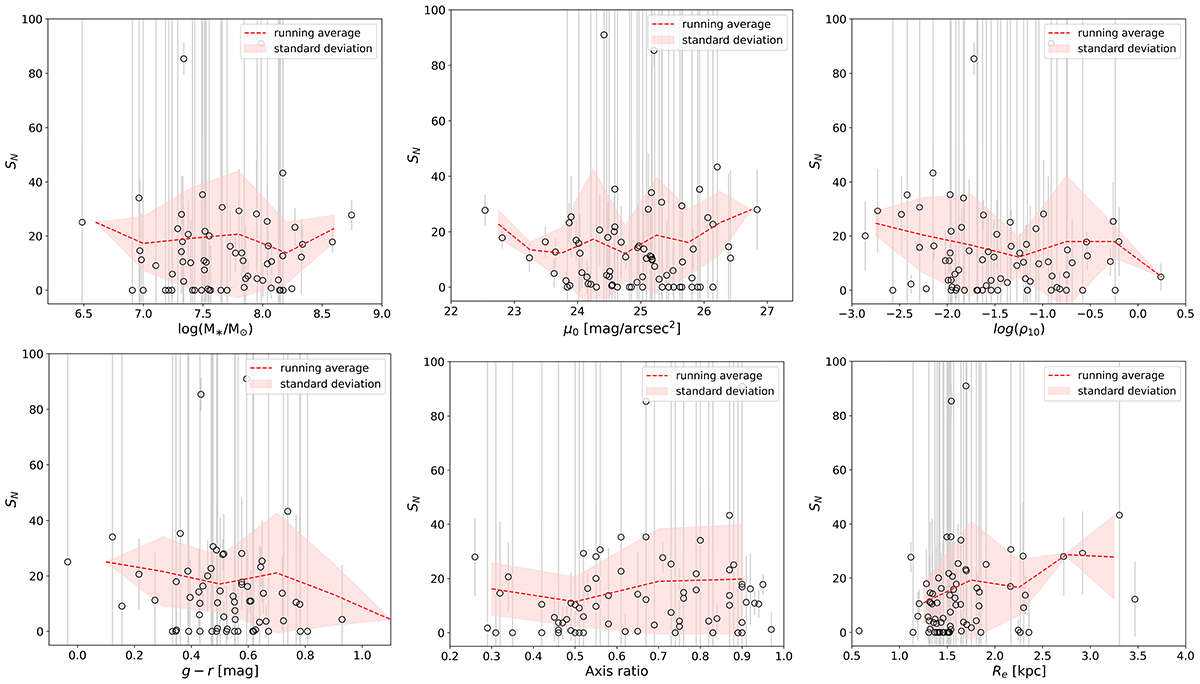
Behaviour of the specific frequency, SN, as a function of key host properties. Top: dependence of SN on the host galaxy stellar mass, central surface brightness (μ0), and local density (log(ρ10)), shown from left to right. There are no obvious trends, except with ρ10, which shows an increase in specific frequency as the local density becomes less dense. Bottom: dependence of SN on host galaxy g − r colour, axis ratio, and effective radius (Re), shown from left to right. The bottom dependencies show the most prominent trends, with an increase in GC counts with bluer colours, increased roundness, and larger size. For all plots, the running average and standard deviation, computed using only non-zero values of NGC, is shown as the red dashed line and light red region, respectively.
Current usage metrics show cumulative count of Article Views (full-text article views including HTML views, PDF and ePub downloads, according to the available data) and Abstracts Views on Vision4Press platform.
Data correspond to usage on the plateform after 2015. The current usage metrics is available 48-96 hours after online publication and is updated daily on week days.
Initial download of the metrics may take a while.