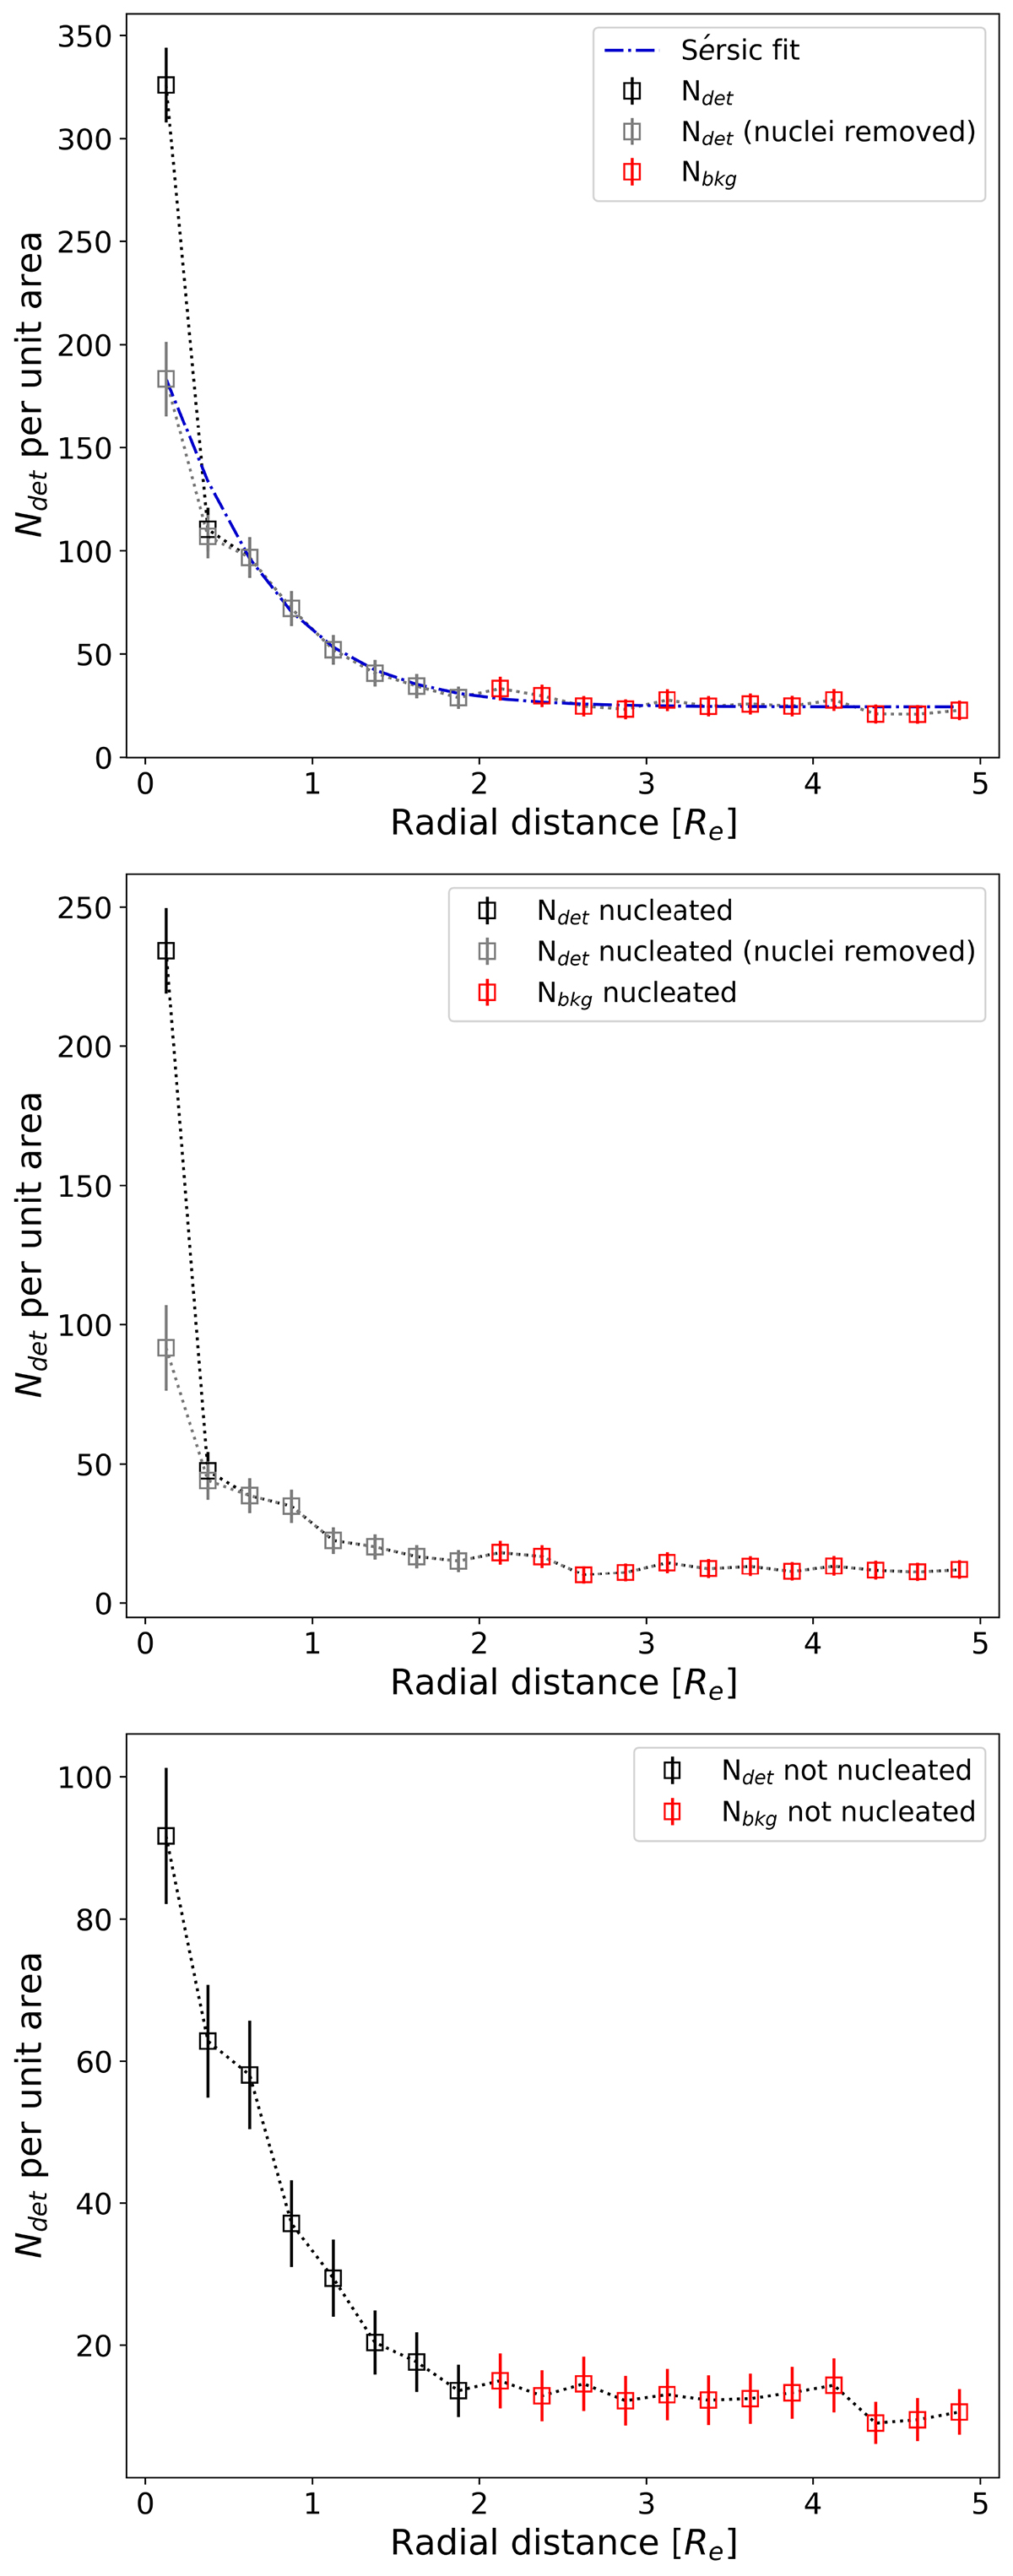
Fig. 13.
Download original image
Radial distributions of the stacked GCs for the UDGs in our HST sample. Top: radial distribution of the stacked GCs for all 74 UDGs in our sample. The black squares are for the GC counts within 2Re while the red squares are the counts outside (background). The counts are also shown with the detection corresponding to the candidate nucleus (or nuclei, in the case of MATLAS-138 and 987) in each galaxy removed (grey points and dotted line). The Sérsic fit is shown with the dash-dot blue line. Middle: same as the top but for the nucleated UDGs only. Bottom: same as the top but for the non-nucleated UDGs only.
Current usage metrics show cumulative count of Article Views (full-text article views including HTML views, PDF and ePub downloads, according to the available data) and Abstracts Views on Vision4Press platform.
Data correspond to usage on the plateform after 2015. The current usage metrics is available 48-96 hours after online publication and is updated daily on week days.
Initial download of the metrics may take a while.