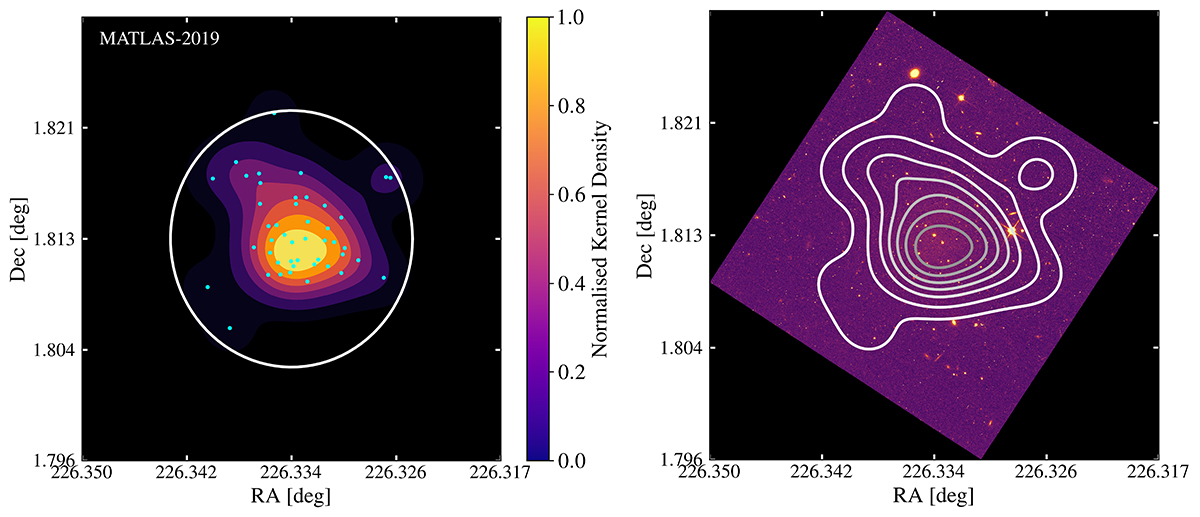
Fig. 12.
Download original image
2D density map of the GC distribution for one of the 12 UDGs with NGC > 10, MATLAS-2019. Left: projected distribution (cyan dots) and density map (coloured map) of the GC candidates detected within 2Re (large white circle). Right: density map (white contours) of the GC candidates is overlaid on the HST F814W image of the UDG. The size of each image is 2.5Re × 2.5Re.
Current usage metrics show cumulative count of Article Views (full-text article views including HTML views, PDF and ePub downloads, according to the available data) and Abstracts Views on Vision4Press platform.
Data correspond to usage on the plateform after 2015. The current usage metrics is available 48-96 hours after online publication and is updated daily on week days.
Initial download of the metrics may take a while.