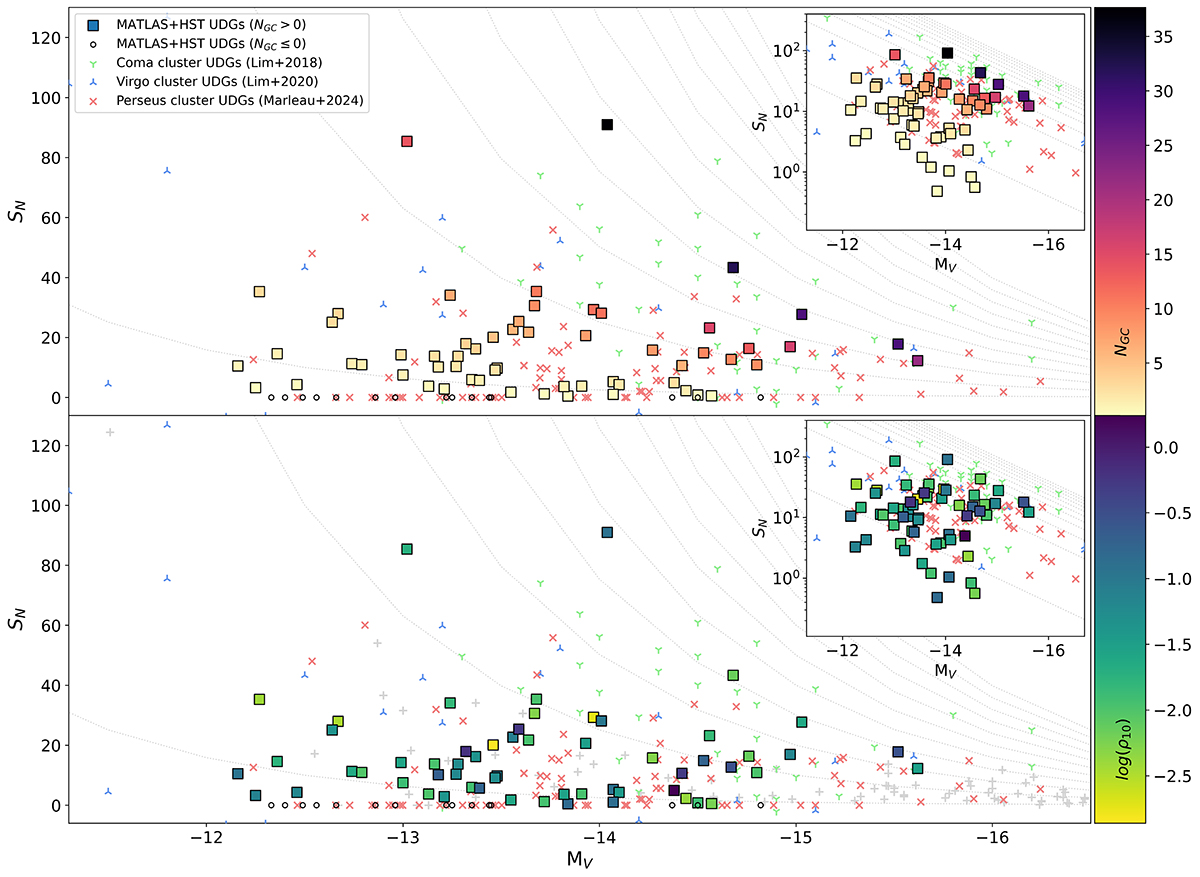
Fig. 10.
Download original image
Specific frequency SN as a function of absolute magnitude for the 74 UDGs in our sample. Top: UDGs with NGC > 0 are shown as squares with colours that scale with the value of the background and completeness corrected GC count, NGC. The UDGs with NGC ≤ 0 are shown as small black circles. Bottom: same as the top but now showing the local density parameter, log(ρ10), in the colour bar. In both plots, the specific frequency of the Coma cluster UDGs (Lim et al. 2018; light green symbols), Virgo cluster UDGs (Lim et al. 2020; light blue symbols), and Perseus cluster UDGs (Marleau et al. 2024; light red symbols) are also plotted. The light grey dashed lines correspond to SN with a constant NGC of 1, 10, 20, ..., 90, 100. The error bars are not shown since they are quite large and can be found in Table A.1. The inset plots display the SN values using a logarithmic scale.
Current usage metrics show cumulative count of Article Views (full-text article views including HTML views, PDF and ePub downloads, according to the available data) and Abstracts Views on Vision4Press platform.
Data correspond to usage on the plateform after 2015. The current usage metrics is available 48-96 hours after online publication and is updated daily on week days.
Initial download of the metrics may take a while.