Open Access
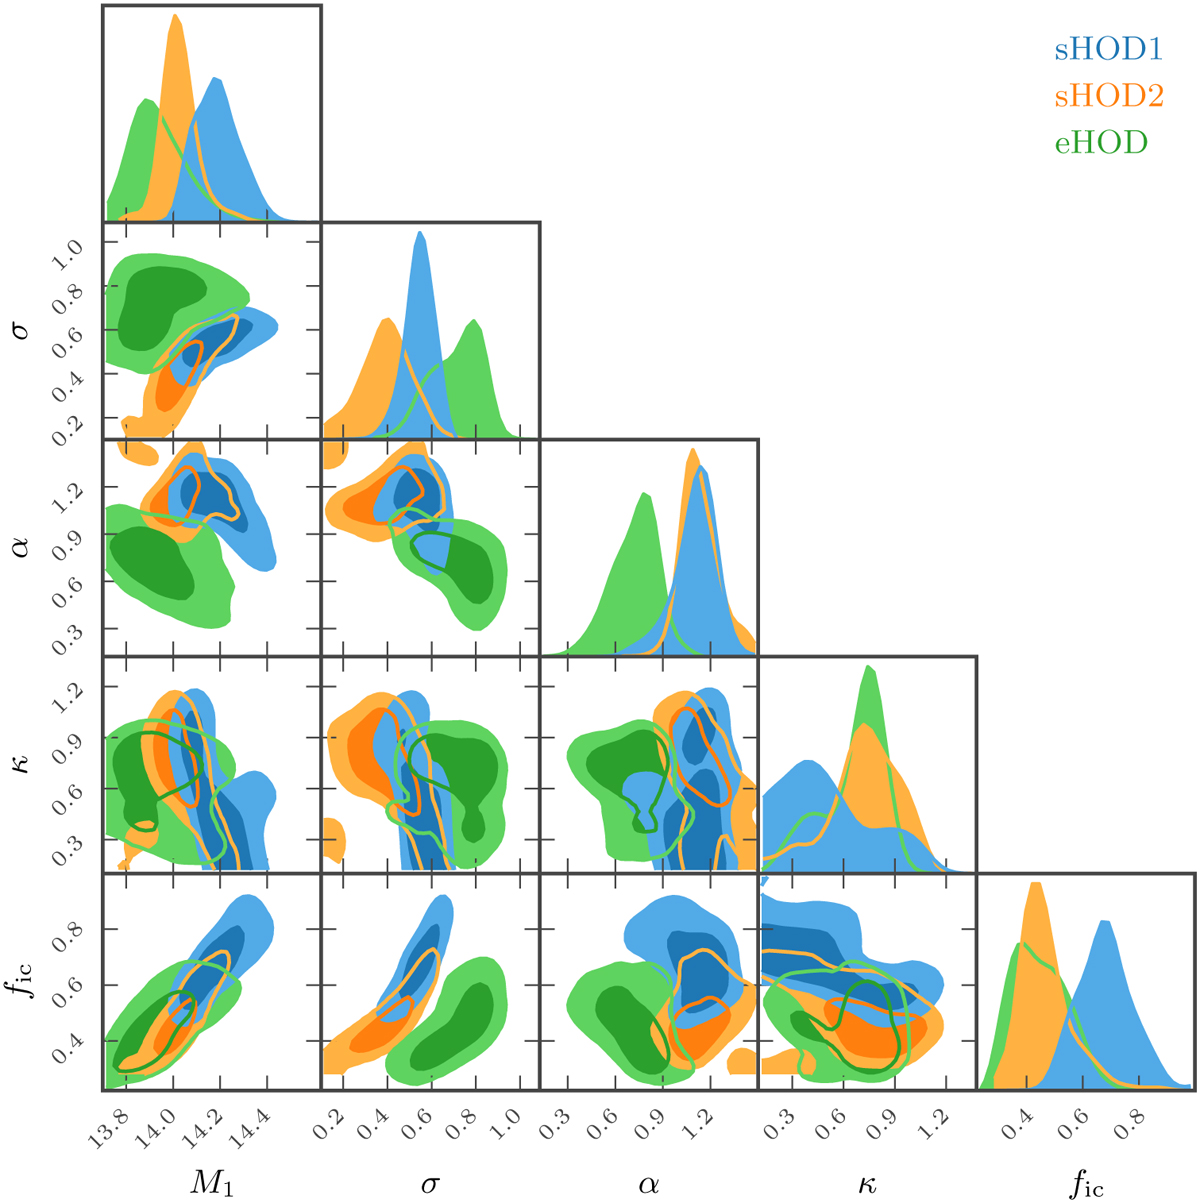
Fig. 4
Download original image
Posterior contours of the sHOD1 (in blue), sHOD2 (in orange), and eHOD (in green) in our baseline configuration (including concentration and annular density as additional parameters) for the LRG sample. One can observe that the extra parameters contained in the eHOD model have a strong impact on the posterior distributions.
Current usage metrics show cumulative count of Article Views (full-text article views including HTML views, PDF and ePub downloads, according to the available data) and Abstracts Views on Vision4Press platform.
Data correspond to usage on the plateform after 2015. The current usage metrics is available 48-96 hours after online publication and is updated daily on week days.
Initial download of the metrics may take a while.