Fig. 2
Download original image
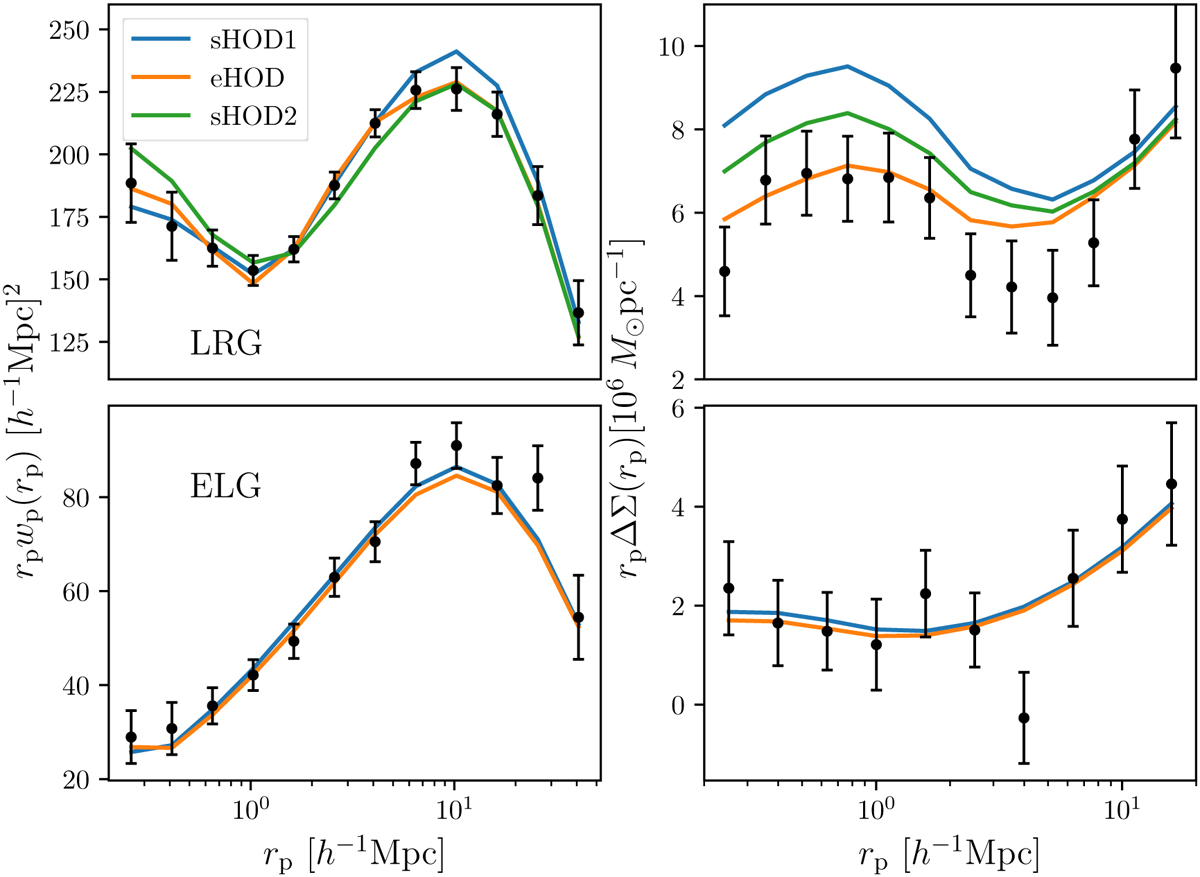
Best-fit HOD models for LRG (top) and ELG (bottom). The subscript ‘s/e’ denotes the standard and extended HOD model. The extended model here corresponds to our fiducial configuration, where the concentration and an annular definition of δ are used as additional parameters. The points with error bars correspond to the measured wp (left) and the ∆Σ (right) signals. The blue lines (sHOD1) correspond to a fit to the projected correlation function wp only, while the green (SHOD2) and orange lines (eHOD) correspond to standard and extended HOD fits including the measurement of ∆Σ in the fitting pipeline. The extended HOD model provides a good description of both the clustering and lensing signal. We did not perform any standard HOD fit to the combined wp + ∆Σ vector for ELGs (sHOD2), as the standard HOD fit to wp only already agrees well with the ∆Σ measurement.
Current usage metrics show cumulative count of Article Views (full-text article views including HTML views, PDF and ePub downloads, according to the available data) and Abstracts Views on Vision4Press platform.
Data correspond to usage on the plateform after 2015. The current usage metrics is available 48-96 hours after online publication and is updated daily on week days.
Initial download of the metrics may take a while.