| Issue |
A&A
Volume 690, October 2024
|
|
|---|---|---|
| Article Number | A93 | |
| Number of page(s) | 9 | |
| Section | Extragalactic astronomy | |
| DOI | https://doi.org/10.1051/0004-6361/202449570 | |
| Published online | 01 October 2024 | |
Extragalactic globular cluster near-infrared spectroscopy
I. Integrated near-infrared spectra of Centaurus A/NGC 5128
1
Shanghai Astronomical Observatory, Chinese Academy of Sciences, 80 Nandan Road, Shanghai 200030, China
2
Departamento de Astronomia, Instituto de Física, Universidade Federal do Rio Grande do Sul (UFRGS), Av. Bento Gonçalves, 9500 Porto Alegre, RS, Brazil
3
Instituto de Astrofísica de Canarias, E-38200 La Laguna, Tenerife, Spain
4
Departamento de Astrofísica, Universidad de La Laguna, E-38205 La Laguna, Tenerife, Spain
5
Instituto de Astronomia, Geofísica e Ciências Atmosféricas, Universidade de São Paulo, 05508-900 São Paulo, Brazil
6
Waterloo Centre for Astrophysics, University of Waterloo, Waterloo, Ontario N2L 3G1, Canada
7
Department of Physics and Astronomy, University of Waterloo, Waterloo, Ontario N2L 3G1, Canada
8
Centre for Astrophysics and Supercomputing, Swinburne University, John Street, Hawthorn, VIC 3122, Australia
9
Department of Astronomy, The Oskar Klein Centre, Stockholm University, AlbaNova, SE-10691 Stockholm, Sweden
Received:
11
February
2024
Accepted:
17
June
2024
Context. One way to constrain the evolutionary histories of galaxies is to analyse their stellar populations. In the local Universe, our understanding of the stellar population properties of galaxies has traditionally relied on the study of optical absorption and emission-line features.
Aims. In order to overcome limitations intrinsic to this wavelength range, such as the age-metallicity degeneracy and the high sensitivity to dust reddening, we must use wavelength ranges beyond the optical. The near-infrared (NIR) offers a possibility to extract information on spectral signatures that are not as obvious in traditional optical bands. Moreover, with the current and forthcoming generation of instrumentation focusing on the NIR, it is mandatory to explore possibilities within this wavelength range for nearby-Universe galaxies. However, although the NIR shows great potential, we are only beginning to understand it. Widely used techniques such as a full spectral fitting and line strength indices need to be tested on systems that are as close to simple stellar populations as possible, and the result from the techniques need to be compared to the yields from a traditional optical analysis.
Methods. We present a NIR spectral survey of extragalactic globular clusters (GCs). The set was composed of 21 GCs from the Centaurus A galaxy that were obtained with SOAR/TripleSpec4, which covered the ∼1.0–2.4 μm range with a spectral resolution (R = λ/Δλ) of 3500. These spectra cover Hβ equivalent widths between 0.98 Å and 4.32 Å, and [MgFe]′ between 0.24 Å and 3.76 Å.
Results. This set was ideal for performing absorption band measurements and a full spectral fitting, and it can be used for kinematic studies and age and abundance measurements. With this library, we expect to be able to probe the capabilities of NIR models, as well as to further improve stellar population estimates for the GCs around the Centaurus A galaxy.
Key words: galaxies: evolution / galaxies: star clusters: general / galaxies: star formation / galaxies: stellar content / infrared: galaxies
© The Authors 2024
 Open Access article, published by EDP Sciences, under the terms of the Creative Commons Attribution License (https://creativecommons.org/licenses/by/4.0), which permits unrestricted use, distribution, and reproduction in any medium, provided the original work is properly cited.
This article is published in open access under the Subscribe to Open model. Subscribe to A&A to support open access publication.
1. Introduction
In order to understand how a galaxy has evolved, it is essential to determine its stellar population (SP) properties. With the star formation history (SFH) in hand, many different events during its evolution can then be traced, such as mergers (van Gorkom et al. 1986; Sesto et al. 2021), past and/or ongoing interactions (Abadi et al. 1999; Steyrleithner et al. 2020), the presence or absence of bars and rings (Allard et al. 2006; Sánchez-Blázquez et al. 2011; Azevedo et al. 2023), an active galactic nucleus (AGN) and outflow activity (Maiolino et al. 2017; Riffel et al. 2021, 2022; Dahmer-Hahn et al. 2022), as well as gas and dust properties (Dwek 1998; Riffel et al. 2009, 2022; Li et al. 2021; Lassen et al. 2021; Reddy et al. 2022).
Although it is possible to individually resolve stars of very close sources (Baade 1944; Brown et al. 2004, 2009; Crnojević et al. 2016), most galaxies beyond the Local Group need to be studied via integrated light. This analysis is either performed with photometry (with either broad- or narrow-band filters) or with spectroscopy (mainly performed through spectral index measurement or full-spectral fitting). With this purpose, the most commonly used wavelength range by far is the optical (e.g. Worthey 1994; Cid Fernandes et al. 2004, 2005; Beasley et al. 2008; Chen et al. 2010; Mallmann et al. 2018; Sánchez et al. 2016; Dahmer-Hahn et al. 2022; Nascimento et al. 2022; Riffel et al. 2023, among many others). However, despite their ubiquity, optical wavelengths pose many problems, such as the age-metallicity degeneracy (which is stronger for colours, but still present for spectral index analysis and full-spectral fitting Worthey 1994; Conroy et al. 2018), the high sensitivity to dust reddening (Riffel et al. 2008, 2009), and the low spatial resolution for ground-based telescopes.
The near-infrared (NIR) is usually dominated by cool giants, which has long been proposed to soften or even resolve these problems when employed in combination with optical bands (Maraston 2005; Marigo et al. 2008). At the youngest ages, this domination of cool giants in the NIR is exacted through red supergiants, while at older ages, the red giant branch (RGB), red clump (RC), and asymptotic giant branch (AGB) dominate. For objects older than some billion years, the RGB/RC/AGB region is only weakly dependent on age. This means that it is possible to measure metallicities and abundances in a largely age-independent way. These abundances can be measured from a wealth of molecular bands in the NIR spectral region, including C2, CN, CO, H2, TiO, VO, FeH, and ZrO, as well as strong atomic lines for elements such as Na, Mg, Al, Si, K, Ca, Ti, and Fe (Rayner et al. 2009; Riffel et al. 2007, 2015, 2019; Eftekhari et al. 2021). The CO (in the NIR) and OH (at 3.3 μm) molecular features are of particular interest because they can be used to measure the O abundance, which is challenging to do in the optical with integrated light. Therefore, there is growing interest in studying stellar populations of nearby galaxies using the NIR wavelength range (Origlia et al. 1993; Origlia & Oliva 2000; Martins et al. 2010; Storchi-Bergmann et al. 2012; Riffel et al. 2008, 2009, 2010, 2011a, 2015; Dametto et al. 2014, 2019; Mason et al. 2015; Diniz et al. 2017, 2019; Dahmer-Hahn et al. 2018, 2019; Baldwin et al. 2018; Eftekhari et al. 2021; Riffel et al. 2019, 2022, 2024).
Although the first NIR spectra were obtained over 140 years ago (Abney & Festing 1881), the instruments achieved a capacity comparable to optical spectroscopy only very recently. However, even though the NIR has the potential to resolve many issues in traditional optical studies, stellar population modelling in this wavelength range is still in its infancy, with significant differences in the predicted spectral energy distributions between models (Bruzual & Charlot 2003; Maraston 2005; Conroy et al. 2009; Meneses-Goytia et al. 2015; Vazdekis et al. 2016; Millán-Irigoyen et al. 2021; Eftekhari et al. 2022a). For example, Baldwin et al. (2018) and Dahmer-Hahn et al. (2018) analysed different sets of models and reported that current NIR models could not produce reliable results, with each library finding a different dominant population independent of the object spectra. The most puzzling case is that of the CO absorption bands of massive early-type galaxies (ETGs), which are prominent in the H- and K-band spectral regions. This mismatch has so far been attributed to an enhanced contribution of stars in the thermally pulsating AGB evolutionary phase, which dominates the NIR light of intermediate-age (peaking at ∼1.6 Gyr, Marigo et al. 2017) SPs. Whether this enhanced contribution is real is still a matter of debate (see Maraston 2005; Capozzi et al. 2016; Marigo et al. 2017; Eftekhari et al. 2022b, for example).
Riffel et al. (2019) studied different libraries of models and found that the models fail to reproduce the observed stellar absorptions of galaxies. A few other important results (Riffel et al. 2011b; Chies-Santos et al. 2011a,b; Conroy et al. 2009; Powalka et al. 2016b,a; Dametto et al. 2019) also highlighted the issues of current simple stellar population (SSP) models to predict the properties of galactic and extragalactic globular clusters (GCs). Behind these issues is our lack of understanding of crucial phases that dominate the light in this range, such as thermally pulsing AGB stars.
Empirical studies attempting to resolve these issues commonly make use of galaxy spectra, which are composed of many sets of stellar populations (e.g. Riffel et al. 2007; Baldwin et al. 2018; Dahmer-Hahn et al. 2018; Riffel et al. 2015, 2019). Ideally, these studies should be carried out with spectra of simpler stellar populations, such as GCs, in order to overcome these difficulties. However, the low number of public spectra for GCs outside the Milky Way is still an issue, especially in the NIR. Homogeneous and large samples of integrated spectra of GCs in the NIR would provide the opportunity to probe stellar populations with metallicities and ages beyond what is commonly found in the environment of our Galaxy.
Although there are still many issues to be solved, the addition of the NIR spectral range to studies of GCs was shown to have great potential. For instance, Blakeslee et al. (2012), Chies-Santos et al. (2012), Cho et al. (2016) showed that by combining optical/NIR colour indices, the metallicities can be studied better than based on optical colours alone. At the same time, the NIR is nearly insensitive to the effect of hot horizontal branch stars, which are known to be present in massive old GCs (Chies-Santos et al. 2012; Georgiev et al. 2012). Nevertheless, although the stellar populations of GCs are simpler by far than galaxy populations, inconsistencies in stellar population measurements when using the NIR spectral range have persisted for about two decades. Hempel et al. (2003) reported by directly comparing optical/NIR models to data large fractions of intermediate-age GCs (∼2–8 Gyr) in old elliptical galaxies. Chies-Santos et al. (2011b,a) reported based on the analysis of a set of 14 galaxies using optical+NIR photometry no significant difference between the mean ages of GCs among elliptical galaxies. They also reported that SSP models fail to reproduce GC properties in colour-colour diagrams. The offset between observed and modelled colours was likely to yield erroneous age results from colour-colour diagnostic diagrams. This result was later revisited and confirmed by Powalka et al. (2016a), who analysed 2000 GCs from the Next Generation Virgo Survey (NGVS, Ferrarese et al. 2012) using optical+NIR data. They reported that SSP models from different groups inconsistently match different colour-colour diagrams. Powalka et al. (2016b) expanded these results and showed that the most popular SSP models used by the astronomical community disagree remarkably with the colour distributions of M87 GCs. The authors found that these variances can be attributed to environmental effects. A denser environment produces a wider dynamic range in certain colour indices. This demonstrates that stellar population diagnostics derived from model predictions calibrated on one particular sample of GCs (which is the case for most studies) may not be appropriate for all extragalactic GCs.
Another important result was obtained by Usher et al. (2015), who employed data from the SAGES Legacy Unifying Globulars and GalaxieS (SLUGGS, Brodie et al. 2014). By using stacked GC spectra in the red part of the optical spectral range (6500–9000 Å), they showed that GCs with the same colours and absolute magnitudes in different galaxies showed different metal line strengths, suggesting different metallicities. After showing that the strength of the calcium triplet (CaT) spectral feature at 8600 Å is largely insensitive to age for populations older than a few billion years (Usher et al. 2019a), Usher et al. (2019b) used a combination of optical photometry and metallicity measured from the CaT to show that the age distribution and age-metallicity relation of GCs can vary wildly between galaxies in a manner connected to the galactic assembly histories. Thus, the stellar population properties of GCs seem to vary significantly for different galaxies (Usher et al. 2015) and environments (Powalka et al. 2016a).
With the current James Webb Space Telescope and upcoming telescopes and instruments focused on the NIR, such as the Euclid and the Nancy Grace Roman telescopes, and the planned NIR instruments on 30–40m class telescopes such as ELT1/MOSAIC2 and the next generation of spectrographs on the 10 m class telescopes, that is, MOONS3/VLT4 and PFS5/Subaru, the need for reliable NIR SSP models especially for spectral analysis is clear. However, there is currently a lack of high-quality star cluster spectra in the NIR to verify stellar population models in this wavelength region. Previous GC libraries (e.g. Lyubenova et al. 2010; Sakari et al. 2016) have focused on a single NIR band at a time, which limits the amount of useful information and the number of comparisons that can be made.
We present a spectral library of extragalactic globular clusters covering the whole 1.0–2.4 μm at the same time. This is part of the extragalactic globular clusters near-infrared spectroscopy (LIBERTY) initiative, which is aimed at studying NIR spectra of GCs in nearby galaxies. Our interests are twofold. On the one hand, we wish to use GCs to test stellar population models, and on the other hand, we wish to study galaxy evolution with GCs. This study is the first of a series of papers analysing the properties of these GC spectra. The second paper of this series, Eftekhari et al. (in prep., Paper II), describes the zero-point problem. Upcoming papers will focus on (i) CO indices, (ii) the remaining indices, and (iii) a full spectral fitting.
This paper is structured as follows: In Section 2, we describe our sample and observations, and we assess the data quality of our data. In Section 3, we present our preliminary results, and our final remarks are given in Section 4.
2. Data
2.1. Sample selection
Our sample comprises 21 GCs of Centaurus A/NGC 5128 (hereafter Cen A), which is one of the most massive galaxies in the nearby Universe. With a stellar mass of ∼1011.21 M⊙, it lies at a distance of ∼3.8 Mpc (Harris et al. 2010; Fall & Romanowsky 2018). These objects are a sub-sample of the objects presented by Beasley et al. (2008, hereafter B08), which have publicly available optical spectra. In order to ensure that our sample covers as many ages and metallicities as possible, we used Hβ as a proxy for age and [MgFe]′ (a composite index constructed from the combination of Mgb, Fe5270, and Fe5335 indices, see Thomas et al. 2003) as a proxy for metallicity. We show in the left panel of Fig. 1 the Hβ × [MgFe]′ coverage in the original B08 sample. Our subsample is highlighted in red.
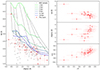 |
Fig. 1. Main properties for our sample. In the left panel, we show that our sample (red diamonds) covers Hβ and [MgFe]′ values from B08 (grey circles). For comparison, we overplot the Hβ × [MgFe]′ grid measured from the E-MILES model library. Different ages are represented using different colours, and the different metallicities are all represented in black (from left to right, the [M/H] tracks are equal to −2.27, −1.79, −1.26, −0.66, −0.25, +0.15, and +0.40). In the right panels, we show the correlations between J − H colours (x-axis) and Hβ (upper), [MgFe]′ (middle), and H − K colours (bottom panels). We plot the respective errors in all panels as red crosses over each respective diamond. |
In order to emphasise the age and composition of our GCs, we overplot in the left panel of Fig 1 a grid with the measurements from the E-MILES stellar population library (Röck et al. 2016; Vazdekis et al. 2016). This grid was constructed using a Kroupa (2001) initial mass function and Pietrinferni et al. (2004) isochrones, spanning six ages (1, 2, 5, 8, 11, and 14 Gyr) and eight metallicities ([M/H] = −2.27, −1.79, −1.26, −0.66, −0.25, +0.15, and +0.40). We discuss in Paper II why most of B08 GCs appear to be older than the age of the Universe in this panel and how the NIR hydrogen index behaves in this regard.
2.2. Observation and data reduction
We obtained integrated spectra of these GCs with the TripleSpec4 instrument, which is attached to the Southern Astrophysical Research Telescope (SOAR) telescope, during two observing runs on 23 March and 24 April 2020, and on 12, 17, and 18 April 2021. The data were obtained through proposals SO2021A-016 (PI: L. G. Dahmer-Hahn) and SO2022A-009 (PI: E. Zanatta). The final sample is presented in Table A.1, together with the main properties.
Since TripleSpec4 does not have any moving parts, all observations were performed with the default slit (1 1), resulting in a spectral resolution of R ≃ 3500 and 0
 33763/pixel sampling. The atmospheric seeing was not recorded for each individual object, but it varied between 0
 7 and 1
 2 throughout the observed nights. During daytime calibrations, we also took on and off flats for flat-field correction, and hollow lamps for the wavelength correction. However, we finally performed the wavelength calibration with sky lines because they were taken at the same time as the objects and therefore did not introduce time biases.
We conducted the data reduction through the default SPEXTOOL IDL pipeline (Vacca et al. 2003; Cushing et al. 2004). This pipeline follows the standard NIR reduction process, which consists of flat-field correction, wavelength calibration (in a vacuum, calibrated from sky emission lines), spatial extraction, telluric band correction, and flux calibration. We performed the spectral extraction by integrating a region of 2 0 centred on the flux peak (∼3σ extraction).
Due to the point-source nature of our sample, the observations were performed by nodding the objects along the slit (ABBA), which partially removed the sky emission. The remaining sky emission was removed by extracting a pure sky spectrum along the slit, away from the A and B regions in the slit. In seven cases (PFF-gc091, HHH86-33, HGHH-G204, HH-080, HHH86-39, HGHH-45, and HGHH-G279), we were not able to fully remove the sky emission even when we combined the two techniques, and their final spectra therefore show varying sky contributions.
After the reduction process, we corrected the data for Doppler shift based on the radial velocities shown in Table A.1, as well as for Milky Way dust reddening using the Cardelli et al. (1989) law and the Schlegel et al. (1998) extinction maps. In order to test the consistency of our data, we also derived redshifts for our sample based on H-band data, where most of the stellar absorption lies. These measurements were performed using the code STARLIGHT (Cid Fernandes et al. 2004, 2005) and E-MILES models (Vazdekis et al. 2016). We found a standard deviation of 30 km s−1 between the optical and NIR measurements, except for two GCs (HGHH-45 and HGHH-G279), for which the method did not converge due to poor S/N and sky residuals. The final rest-frame spectra covering the range 0.96–2.46 μm are shown in Fig 2.
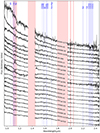 |
Fig. 2. NIR spectra of our sample, normalized at the H band plus a constant, and sorted by J − K colour. Regions with high telluric absorption are masked in red. We also highlight in blue the main stellar absorptions from Riffel et al. (2019) with a sufficient S/N and without an optical counterpart. |
2.2.1. Photometry
In order to provide a catalogue that is as complete as possible for future studies, we also compiled optical and NIR photometrical points. These values are presented in Table A.2 for the globular clusters in our sample. The u′g′r′i′z′ photometry is from Taylor et al. (2017). This catalogue comprises ∼3200 GCs that were observed with the Dark Energy Camera (DECam) at the Blanco Telescope in Cerro Tololo.
Situated at Stripe 30, Cen A was observed in the NIR by the Visible and Infrared Survey Telescope for Astronomy (VISTA Sutherland et al. 2015) as part of the VISTA Hemisphere Survey (VHS, McMahon et al. 2013). VHS uses the 4 m VISTA telescope, located at ESO Paranal Observatory in Chile, to map the southern hemisphere in at least two bands (J and Ks) with 5σ point-source limiting magnitudes of JVEGA = 20.6 and  (McMahon et al. 2013). Using VISTA public data for Cen A, we performed aperture photometry for the 21 GCs in the J and Ks bands using an aperture radius of 6 pixels and circular annuli to estimate the local background. The magnitudes were corrected for foreground Galactic dust extinction using the VHS-DR5 catalogue values, which are based on the Schlegel dust maps (Schlegel et al. 1998). The final magnitudes and associated errors are reported in Table A.2, where the error is calculated as the square root of the sum in quadrature of the photometric and zero-point errors. The final magnitude values were compared to those from the VHS catalogue to check for consistency. The values agree fairly well, with a median absolute difference of 0.03 mag in the J band and 0.06 in the Ks band. To keep the consistency of photometric systems used in Table A.2, we converted the optical magnitudes into the Vega system using the PYPHOT Python package (Fouesneau 2022).
2.2.2. Data quality
Our observations were not performed under a photometric sky, and our flux calibration is therefore not absolute, meaning that the magnitude estimates derived from our spectra should not be directly compared to other works. However, since these observations have been made using cross-dispersed (XD) mode, which obtains the J, H, and K bands at the same time, the colours are much less affected than magnitude zero points because the whole spectra were taken under the same atmosphere (see Nikolaev et al. 2000, for example). In order to estimate the uncertainty in the colour measurements, we derived J − H and H − Ks colours in our spectra (calculated based on 2MASS filters, Cohen et al. 2003). These colours are presented in Table 1. In Fig 3, we compare them with the colours derived from VISTA photometry (Sect 2.2.1). These results indicate that 13 objects are within 0.1 magnitudes of a perfect correlation, 4 objects are between 0.1 and 0.2 magnitudes away from a perfect correlation, and only 3 objects are more than 0.2 magnitudes away.
Properties of our NIR spectra.
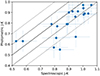 |
Fig. 3. Comparison between J − K colours derived from our spectra with those derived from VISTA photometry. The solid line represents a perfect correlation. The dashed and dotted lines represent a deviation of 0.1 and 0.2 magnitudes from a perfect correlation, respectively. The anomalous/intermediate-age GC HGHH-G279 is not included in this plot because we were unable to derive its K-band photometry from its DECam data. |
We also derived the S/N of the data set over the entire wavelength range. The maximum value achieved in each band is also presented in Table 1, together with the total integration time on target. The object with the highest S/N of our sample is HHH86-30. It reaches almost 100 at the H band. On the other hand, the object with the lowest S/N is HGHH-G279, which is also the faintest object of our sample. Its S/N peaks at 15 in the J band.
3. Cen A LIBERTY properties
In Fig. 1 (panels 2, 3, and 4), we present the correlations between NIR colours derived from our spectra (Sect 2.2.2) and optical Hβ and [MgFe]′ indices. These properties show varying correlations, and the strongest is J − H × H − K.
A special case in our sample is HGHH-G279. Its colours and Hβ are extremely different from the others. The only property that is similar is its [MgFe]′, whose value lies within the values of the other objects of our sample. This object was spectroscopically identified as a younger cluster candidate by Held et al. (2002), and it was photometrically identified by Peng et al. (2004). B08 reported that this object is well reproduced by SSP models with [Z/H]= − 1.2 and 1.7 Gyr. Its J − H and H − K colours, which are very different from those of the other objects in our sample, are consistent with this scenario. However, due to the low S/N of our spectra, it is currently not possible to perform a spectral index analysis or a full spectral fitting, as these would produce unreliable results. Thus, because this GC is unique, a spectrum with a higher S/N needs to be obtained, which would help us understand the NIR stellar population analysis.
Two other objects also show NIR colours that are different from those of the bulk of the sample: HGHH-45 and HHH86-39, with J − H of 0.46 and 0.55, and H − K of 0.06 and 0.02, respectively. However, their optical indices are similar to those of the other GCs. The fact that these objects show similar optical properties but are different in the NIR, is also of much interest because these differences might be able to help us set better constraints on the models. One possibility to explain these differences is that one of these GCs might have strong hot horizontal branch stars (e.g. Cantiello & Blakeslee 2007; Chies-Santos et al. 2012; Cabrera-Ziri & Conroy 2022). Because the NIR is more affected by populations like this, we would be able to spot these differences either by an index analysis or through a full spectral fitting. Future analyses should therefore focus on the cause of these discrepancies. All other objects fall within a similar region that is delimited by J − H > 0.64 and H − K > 0.09.
4. Final remarks
We have presented a NIR (0.96–2.46 μm) spectral survey of extragalactic globular clusters, containing 21 GCs from the galaxy Cen A. These spectra cover Hβ EWs between 0.98 and 4.32 as well as [MgFe]′ between 0.23 and 3.76. This data set was observed with SOAR/TripleSpec4 with a spectral resolution of ∼3500.
These spectra cover the main NIR stellar absorptions and are suitable for an index analysis and for a full spectral fitting. The S/N of our spectra varies within our sample. It peaks between 15 and 100, depending on the object. The colours are also consistent with the photometrical measurements. In our sample, 65% of the objects have J − K colours within 0.1 magnitudes of their photometrical counterpart.
Preliminary results show that most of our sample has similar NIR colours as well as optical ages and metallicities. The NIR colours of three objects (HGHH-G279, HGHH-45, and HHH86-39), on the other hand, differ from those of the rest of our sample. These objects are of great interest to future analyses because their properties are rare among our GCs. Moreover, two of these objects have similar NIR colours but different Lick/IDS indices in the optical, which could indicate a strong difference in their hot horizontal branches.
With the current and upcoming facilities that focus on the infrared, it is very important to develop new techniques that can properly determine ages, metallicities, and general abundances from this wavelength range. This set of spectra provides a unique opportunity to understand the limitations of current models in detail, as well as to develop tools for overcoming these limitations. With this data set in hands, we investigated the zero-point problem in the NIR (Paper II, Eftekhari et al., in prep.), and three future papers are planned to investigate the CO absorptions, the remaining indices, and a full spectral fitting.
Compared to previous NIR libraries of GCs, such as Lyubenova et al. (2010), Sakari et al. (2016), our library has a similar age and metallicity coverage, but encompasses the whole NIR at once, thus allowing for a wider range of studies. Because our goal is to collect as many GCs in different environments, adding NIR spectra of another galaxy moreover allows for much broader studies of the GC evolution.
Data availability
The raw data used throughout this paper are already public and can be accessed through the NOIRLab Astro Data Archive (https://astroarchive.noirlab.edu/). We also intend to make the reduced data fully available for the community in the future. However, since we are still working on two more papers, we can make the data available under reasonable request by e-mail.
Acknowledgments
We thank the anonymous referee for their careful reading of our manuscript and their many insightful comments and suggestions. We acknowledge Chris Usher for useful discussions. LGDH acknowledges support by National Key R&D Program of China No.2022YFF0503402, and National Natural Science Foundation of China (NSFC) project number E345251001. ACS acknowledges funding from the Conselho Nacional de Desenvolvimento Científico e Tecnológico (CNPq), the Rio Grande do Sul Research Foundation (FAPERGS) and the Chinese Academy of Sciences (CAS) President’s International Fellowship Initiative (PIFI) through grants CNPq-11153/2018-6, CNPq-314301/2021-6, FAPERGS/CAPES 19/2551-0000696-9, E085201009. RR acknowledges support from the Fundación Jesús Serra and the Instituto de Astrofísica de Canarias under the Visiting Researcher Programme 2023-2025 agreed between both institutions. RR, also acknowledges support from the ACIISI, Consejería de Economía, Conocimiento y Empleo del Gobierno de Canarias and the European Regional Development Fund (ERDF) under grant with reference ProID2021010079, and the support through the RAVET project by the grant PID2019-107427GB-C32 from the Spanish Ministry of Science, Innovation and Universities MCIU. This work has also been supported through the IAC project TRACES, which is partially supported through the state budget and the regional budget of the Consejería de Economía, Industria, Comercio y Conocimiento of the Canary Islands Autonomous Community. RR also thanks to Conselho Nacional de Desenvolvimento Científico e Tecnológico ( CNPq, Proj. 311223/2020-6, 304927/2017-1 and 400352/2016-8), Fundação de amparo à pesquisa do Rio Grande do Sul (FAPERGS, Proj. 16/2551-0000251-7 and 19/1750-2), Coordenação de Aperfeiçoamento de Pessoal de Nível Superior (CAPES, Proj. 0001). AEL acknowledges the support from Coordenação de Aperfeiçoamento de Pessoal de Nível Superior (CAPES) in the scope of the Program CAPES-PrInt, process number 88887.837405/2023-00 and CAPES-PROEX fellowship, process number 88887.513351/2020-00. EE and AV acknowledge support from grant PID2021-123313NA-I00 and PID2022-140869NB-I00 from the Spanish Ministry of Science, Innovation and Universities MCIU, as well as the grant POKEBOWL PID2021-123313NA-I00 from the MCIN/AEI and the European Regional Development Fund (ERDF).
References
- Abadi, M. G., Moore, B., & Bower, R. G. 1999, MNRAS, 308, 947 [Google Scholar]
- Abney, W. D. W., & Festing, L.-C. 1881, Phil. Trans. R. Soc., 172, 887 [Google Scholar]
- Allard, E. L., Knapen, J. H., Peletier, R. F., & Sarzi, M. 2006, MNRAS, 371, 1087 [CrossRef] [Google Scholar]
- Azevedo, G. M., Chies-Santos, A. L., Riffel, R., et al. 2023, MNRAS, 523, 4680 [NASA ADS] [CrossRef] [Google Scholar]
- Baade, W. 1944, ApJ, 100, 137 [NASA ADS] [CrossRef] [Google Scholar]
- Baldwin, C., McDermid, R. M., Kuntschner, H., Maraston, C., & Conroy, C. 2018, MNRAS, 473, 4698 [Google Scholar]
- Beasley, M. A., Bridges, T., Peng, E., et al. 2008, MNRAS, 386, 1443 [NASA ADS] [CrossRef] [Google Scholar]
- Blakeslee, J. P., Cho, H., Peng, E. W., et al. 2012, ApJ, 746, 88 [NASA ADS] [CrossRef] [Google Scholar]
- Brodie, J. P., Romanowsky, A. J., Strader, J., et al. 2014, ApJ, 796, 52 [Google Scholar]
- Brown, T. M., Ferguson, H. C., Smith, E., et al. 2004, ApJ, 613, L125 [NASA ADS] [CrossRef] [Google Scholar]
- Brown, T. M., Smith, E., Ferguson, H. C., et al. 2009, ApJS, 184, 152 [NASA ADS] [CrossRef] [Google Scholar]
- Bruzual, G., & Charlot, S. 2003, MNRAS, 344, 1000 [NASA ADS] [CrossRef] [Google Scholar]
- Cabrera-Ziri, I., & Conroy, C. 2022, MNRAS, 511, 341 [NASA ADS] [CrossRef] [Google Scholar]
- Cantiello, M., & Blakeslee, J. P. 2007, ApJ, 669, 982 [NASA ADS] [CrossRef] [Google Scholar]
- Capozzi, D., Maraston, C., Daddi, E., et al. 2016, MNRAS, 456, 790 [NASA ADS] [CrossRef] [Google Scholar]
- Cardelli, J. A., Clayton, G. C., & Mathis, J. S. 1989, ApJ, 345, 245 [Google Scholar]
- Chen, X. Y., Liang, Y. C., Hammer, F., et al. 2010, A&A, 515, A101 [NASA ADS] [CrossRef] [EDP Sciences] [Google Scholar]
- Chies-Santos, A. L., Larsen, S. S., Kuntschner, H., et al. 2011a, A&A, 525, A20 [NASA ADS] [CrossRef] [EDP Sciences] [Google Scholar]
- Chies-Santos, A. L., Larsen, S. S., Wehner, E. M., et al. 2011b, A&A, 525, A19 [NASA ADS] [CrossRef] [EDP Sciences] [Google Scholar]
- Chies-Santos, A. L., Larsen, S. S., & Kissler-Patig, M. 2012, MNRAS, 427, 2349 [NASA ADS] [CrossRef] [Google Scholar]
- Cho, H., Blakeslee, J. P., Chies-Santos, A. L., et al. 2016, ApJ, 822, 95 [NASA ADS] [CrossRef] [Google Scholar]
- Cid Fernandes, R., Gu, Q., Melnick, J., et al. 2004, MNRAS, 355, 273 [Google Scholar]
- Cid Fernandes, R., Mateus, A., Sodré, L., Stasińska, G., & Gomes, J. M. 2005, MNRAS, 358, 363 [Google Scholar]
- Cohen, M., Wheaton, W. A., & Megeath, S. T. 2003, AJ, 126, 1090 [Google Scholar]
- Conroy, C., Gunn, J. E., & White, M. 2009, ApJ, 699, 486 [Google Scholar]
- Conroy, C., Villaume, A., van Dokkum, P. G., & Lind, K. 2018, ApJ, 854, 139 [Google Scholar]
- Crnojević, D., Sand, D. J., Spekkens, K., et al. 2016, ApJ, 823, 19 [Google Scholar]
- Cushing, M. C., Vacca, W. D., & Rayner, J. T. 2004, PASP, 116, 362 [NASA ADS] [CrossRef] [Google Scholar]
- Dahmer-Hahn, L. G., Riffel, R., Rodríguez-Ardila, A., et al. 2018, MNRAS, 476, 4459 [Google Scholar]
- Dahmer-Hahn, L. G., Riffel, R., Steiner, J. E., et al. 2019, MNRAS, 482, 5211 [NASA ADS] [CrossRef] [Google Scholar]
- Dahmer-Hahn, L. G., Riffel, R., Rodríguez-Ardila, A., et al. 2022, MNRAS, 509, 4653 [Google Scholar]
- Dametto, N. Z., Riffel, R., Pastoriza, M. G., et al. 2014, MNRAS, 443, 1754 [Google Scholar]
- Dametto, N. Z., Riffel, R., Colina, L., et al. 2019, MNRAS, 482, 4437 [Google Scholar]
- Diniz, M. R., Riffel, R. A., Riffel, R., et al. 2017, MNRAS, 469, 3286 [NASA ADS] [CrossRef] [Google Scholar]
- Diniz, M. R., Riffel, R. A., Storchi-Bergmann, T., & Riffel, R. 2019, MNRAS, 487, 3958 [NASA ADS] [CrossRef] [Google Scholar]
- Dwek, E. 1998, ApJ, 501, 643 [NASA ADS] [CrossRef] [Google Scholar]
- Eftekhari, E., Vazdekis, A., & La Barbera, F. 2021, MNRAS, 504, 2190 [CrossRef] [Google Scholar]
- Eftekhari, E., La Barbera, F., Vazdekis, A., Allende Prieto, C., & Knowles, A. T. 2022a, MNRAS, 512, 378 [NASA ADS] [CrossRef] [Google Scholar]
- Eftekhari, E., La Barbera, F., Vazdekis, A., & Beasley, M. 2022b, MNRAS, 515, L56 [CrossRef] [Google Scholar]
- Fall, S. M., & Romanowsky, A. J. 2018, ApJ, 868, 133 [Google Scholar]
- Ferrarese, L., Côté, P., Cuillandre, J.-C., et al. 2012, ApJS, 200, 4 [Google Scholar]
- Fouesneau, M. 2022, pyphot, https://www.doi.org/10.5281/zenodo.7016775 [Google Scholar]
- Georgiev, I. Y., Goudfrooij, P., & Puzia, T. H. 2012, MNRAS, 420, 1317 [NASA ADS] [CrossRef] [Google Scholar]
- Harris, G. L. H., Rejkuba, M., & Harris, W. E. 2010, PASA, 27, 457 [NASA ADS] [CrossRef] [Google Scholar]
- Held, E. V., Federici, L., Cacciari, C., & Testa, V. 2002, IAU Symp., 207, 269 [NASA ADS] [Google Scholar]
- Hempel, M., Hilker, M., Kissler-Patig, M., et al. 2003, A&A, 405, 487 [NASA ADS] [CrossRef] [EDP Sciences] [Google Scholar]
- Kroupa, P. 2001, MNRAS, 322, 231 [NASA ADS] [CrossRef] [Google Scholar]
- Lassen, A. E., Riffel, R., Chies-Santos, A. L., et al. 2021, MNRAS, 506, 3527 [CrossRef] [Google Scholar]
- Li, Q., Narayanan, D., Torrey, P., Davé, R., & Vogelsberger, M. 2021, MNRAS, 507, 548 [NASA ADS] [CrossRef] [Google Scholar]
- Lyubenova, M., Kuntschner, H., Rejkuba, M., et al. 2010, A&A, 510, A19 [NASA ADS] [CrossRef] [EDP Sciences] [Google Scholar]
- Maiolino, R., Russell, H. R., Fabian, A. C., et al. 2017, Nature, 544, 202 [Google Scholar]
- Mallmann, N. D., Riffel, R., Storchi-Bergmann, T., et al. 2018, MNRAS, 478, 5491 [NASA ADS] [CrossRef] [Google Scholar]
- Maraston, C. 2005, MNRAS, 362, 799 [NASA ADS] [CrossRef] [Google Scholar]
- Marigo, P., Girardi, L., Bressan, A., et al. 2008, A&A, 482, 883 [NASA ADS] [CrossRef] [EDP Sciences] [Google Scholar]
- Marigo, P., Girardi, L., Bressan, A., et al. 2017, ApJ, 835, 77 [Google Scholar]
- Martins, L. P., Riffel, R., Rodríguez-Ardila, A., Gruenwald, R., & de Souza, R. 2010, MNRAS, 406, 2185 [NASA ADS] [CrossRef] [Google Scholar]
- Mason, R. E., Rodríguez-Ardila, A., Martins, L., et al. 2015, ApJS, 217, 13 [NASA ADS] [CrossRef] [Google Scholar]
- McMahon, R. G., Banerji, M., Gonzalez, E., et al. 2013, The Messenger, 154, 35 [NASA ADS] [Google Scholar]
- Meneses-Goytia, S., Peletier, R. F., Trager, S. C., & Vazdekis, A. 2015, A&A, 582, A97 [NASA ADS] [CrossRef] [EDP Sciences] [Google Scholar]
- Millán-Irigoyen, I., Mollá, M., Cerviño, M., et al. 2021, MNRAS, 506, 4781 [CrossRef] [Google Scholar]
- Nascimento, R. S., Rodríguez-Ardila, A., Dahmer-Hahn, L., et al. 2022, MNRAS, 511, 214 [NASA ADS] [CrossRef] [Google Scholar]
- Nikolaev, S., Weinberg, M. D., Skrutskie, M. F., et al. 2000, AJ, 120, 3340 [NASA ADS] [CrossRef] [Google Scholar]
- Origlia, L., Moorwood, A. F. M., & Oliva, E. 1993, A&A, 280, 536 [NASA ADS] [Google Scholar]
- Origlia, L., & Oliva, E. 2000, A&A, 357, 61 [NASA ADS] [Google Scholar]
- Peng, E. W., Ford, H. C., & Freeman, K. C. 2004, ApJ, 602, 705 [NASA ADS] [CrossRef] [Google Scholar]
- Pietrinferni, A., Cassisi, S., Salaris, M., & Castelli, F. 2004, ApJ, 612, 168 [Google Scholar]
- Powalka, M., Lançon, A., Puzia, T. H., et al. 2016a, ApJS, 227, 12 [Google Scholar]
- Powalka, M., Puzia, T. H., Lançon, A., et al. 2016b, ApJ, 829, L5 [NASA ADS] [CrossRef] [Google Scholar]
- Rayner, J. T., Cushing, M. C., & Vacca, W. D. 2009, ApJS, 185, 289 [Google Scholar]
- Reddy, N. A., Topping, M. W., Shapley, A. E., et al. 2022, ApJ, 926, 31 [NASA ADS] [CrossRef] [Google Scholar]
- Riffel, R., Pastoriza, M. G., Rodríguez-Ardila, A., & Maraston, C. 2007, ApJ, 659, L103 [NASA ADS] [CrossRef] [Google Scholar]
- Riffel, R., Pastoriza, M. G., Rodríguez-Ardila, A., & Maraston, C. 2008, MNRAS, 388, 803 [NASA ADS] [CrossRef] [Google Scholar]
- Riffel, R., Pastoriza, M. G., Rodríguez-Ardila, A., & Bonatto, C. 2009, MNRAS, 400, 273 [Google Scholar]
- Riffel, R. A., Storchi-Bergmann, T., Riffel, R., & Pastoriza, M. G. 2010, ApJ, 713, 469 [NASA ADS] [CrossRef] [Google Scholar]
- Riffel, R., Riffel, R. A., Ferrari, F., & Storchi-Bergmann, T. 2011a, MNRAS, 416, 493 [NASA ADS] [Google Scholar]
- Riffel, R., Ruschel-Dutra, D., Pastoriza, M. G., et al. 2011b, MNRAS, 410, 2714 [NASA ADS] [CrossRef] [Google Scholar]
- Riffel, R., Mason, R. E., Martins, L. P., et al. 2015, MNRAS, 450, 3069 [NASA ADS] [CrossRef] [Google Scholar]
- Riffel, R., Rodríguez-Ardila, A., Brotherton, M. S., et al. 2019, MNRAS, 486, 3228 [Google Scholar]
- Riffel, R., Mallmann, N. D., Ilha, G. S., et al. 2021, MNRAS, 501, 4064 [NASA ADS] [CrossRef] [Google Scholar]
- Riffel, R., Dahmer-Hahn, L. G., Riffel, R. A., et al. 2022, MNRAS, 512, 3906 [NASA ADS] [CrossRef] [Google Scholar]
- Riffel, R., Mallmann, N. D., Rembold, S. B., et al. 2023, MNRAS, 524, 5640 [NASA ADS] [CrossRef] [Google Scholar]
- Riffel, R., Dahmer-Hahn, L. G., Vazdekis, A., et al. 2024, MNRAS, [arXiv:2405.00634] [Google Scholar]
- Röck, B., Vazdekis, A., Ricciardelli, E., et al. 2016, A&A, 589, A73 [NASA ADS] [CrossRef] [EDP Sciences] [Google Scholar]
- Sakari, C. M., Shetrone, M. D., Schiavon, R. P., et al. 2016, ApJ, 829, 116 [NASA ADS] [CrossRef] [Google Scholar]
- Sánchez-Blázquez, P., Ocvirk, P., Gibson, B. K., Pérez, I., & Peletier, R. F. 2011, MNRAS, 415, 709 [Google Scholar]
- Sánchez, S. F., Pérez, E., Sánchez-Blázquez, P., et al. 2016, Rev. Mex. Astron. Astrofis., 52, 21 [NASA ADS] [Google Scholar]
- Schlegel, D. J., Finkbeiner, D. P., & Davis, M. 1998, ApJ, 500, 525 [Google Scholar]
- Sesto, L. A., Escudero, C. G., Faifer, F. R., et al. 2021, Boletin de la Asociacion Argentina de Astronomia La Plata Argentina, 62, 225 [NASA ADS] [Google Scholar]
- Steyrleithner, P., Hensler, G., & Boselli, A. 2020, MNRAS, 494, 1114 [Google Scholar]
- Storchi-Bergmann, T., Riffel, R. A., Riffel, R., et al. 2012, ApJ, 755, 87 [NASA ADS] [CrossRef] [Google Scholar]
- Sutherland, W., Emerson, J., Dalton, G., et al. 2015, A&A, 575, A25 [NASA ADS] [CrossRef] [EDP Sciences] [Google Scholar]
- Taylor, M. A., Puzia, T. H., Muñoz, R. P., et al. 2017, MNRAS, 469, 3444 [NASA ADS] [CrossRef] [Google Scholar]
- Thomas, D., Maraston, C., & Bender, R. 2003, MNRAS, 339, 897 [NASA ADS] [CrossRef] [Google Scholar]
- Usher, C., Forbes, D. A., Brodie, J. P., et al. 2015, MNRAS, 446, 369 [NASA ADS] [CrossRef] [Google Scholar]
- Usher, C., Beckwith, T., Bellstedt, S., et al. 2019a, MNRAS, 482, 1275 [Google Scholar]
- Usher, C., Brodie, J. P., Forbes, D. A., et al. 2019b, MNRAS, 490, 491 [NASA ADS] [CrossRef] [Google Scholar]
- Vacca, W. D., Cushing, M. C., & Rayner, J. T. 2003, PASP, 115, 389 [NASA ADS] [CrossRef] [Google Scholar]
- van Gorkom, J. H., Knapp, G. R., Raimond, E., Faber, S. M., & Gallagher, J. S. 1986, AJ, 91, 791 [Google Scholar]
- Vazdekis, A., Koleva, M., Ricciardelli, E., Röck, B., & Falcón-Barroso, J. 2016, MNRAS, 463, 3409 [Google Scholar]
- Worthey, G. 1994, ApJS, 95, 107 [Google Scholar]
Appendix A: Sample properties and photometry
In Tab A.1, we present the sample used throughout this paper, as well as their main properties. In Tab A.2, we show optical and NIR photometrical points, derived from DECam/Blanco and the VISTA survey, respectively.
Sample properties
Photometry and associated uncertainties for the GC sample in the Vega photometric system.
All Tables
Photometry and associated uncertainties for the GC sample in the Vega photometric system.
All Figures
|
Fig. 1. Main properties for our sample. In the left panel, we show that our sample (red diamonds) covers Hβ and [MgFe]′ values from B08 (grey circles). For comparison, we overplot the Hβ × [MgFe]′ grid measured from the E-MILES model library. Different ages are represented using different colours, and the different metallicities are all represented in black (from left to right, the [M/H] tracks are equal to −2.27, −1.79, −1.26, −0.66, −0.25, +0.15, and +0.40). In the right panels, we show the correlations between J − H colours (x-axis) and Hβ (upper), [MgFe]′ (middle), and H − K colours (bottom panels). We plot the respective errors in all panels as red crosses over each respective diamond. |
| In the text | |
|
Fig. 2. NIR spectra of our sample, normalized at the H band plus a constant, and sorted by J − K colour. Regions with high telluric absorption are masked in red. We also highlight in blue the main stellar absorptions from Riffel et al. (2019) with a sufficient S/N and without an optical counterpart. |
| In the text | |
|
Fig. 3. Comparison between J − K colours derived from our spectra with those derived from VISTA photometry. The solid line represents a perfect correlation. The dashed and dotted lines represent a deviation of 0.1 and 0.2 magnitudes from a perfect correlation, respectively. The anomalous/intermediate-age GC HGHH-G279 is not included in this plot because we were unable to derive its K-band photometry from its DECam data. |
| In the text | |
Current usage metrics show cumulative count of Article Views (full-text article views including HTML views, PDF and ePub downloads, according to the available data) and Abstracts Views on Vision4Press platform.
Data correspond to usage on the plateform after 2015. The current usage metrics is available 48-96 hours after online publication and is updated daily on week days.
Initial download of the metrics may take a while.