Open Access
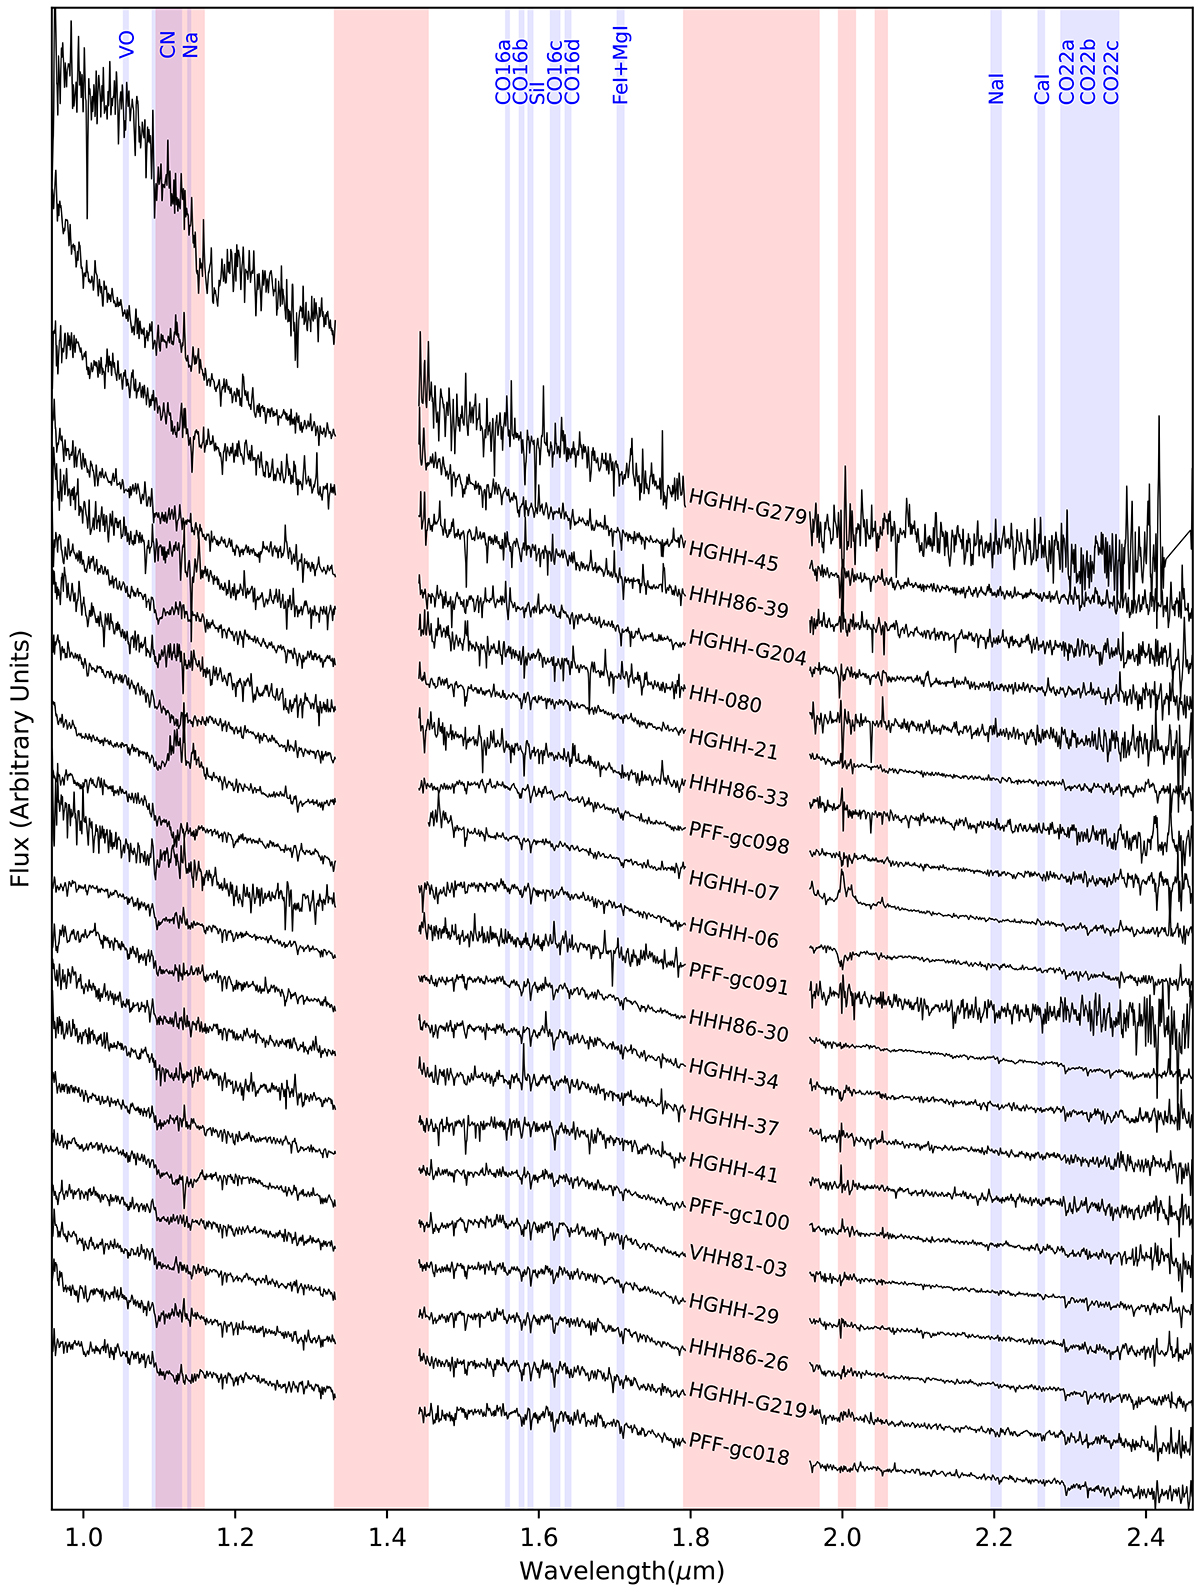
Fig. 2.
Download original image
NIR spectra of our sample, normalized at the H band plus a constant, and sorted by J − K colour. Regions with high telluric absorption are masked in red. We also highlight in blue the main stellar absorptions from Riffel et al. (2019) with a sufficient S/N and without an optical counterpart.
Current usage metrics show cumulative count of Article Views (full-text article views including HTML views, PDF and ePub downloads, according to the available data) and Abstracts Views on Vision4Press platform.
Data correspond to usage on the plateform after 2015. The current usage metrics is available 48-96 hours after online publication and is updated daily on week days.
Initial download of the metrics may take a while.