Fig. 3.
Download original image
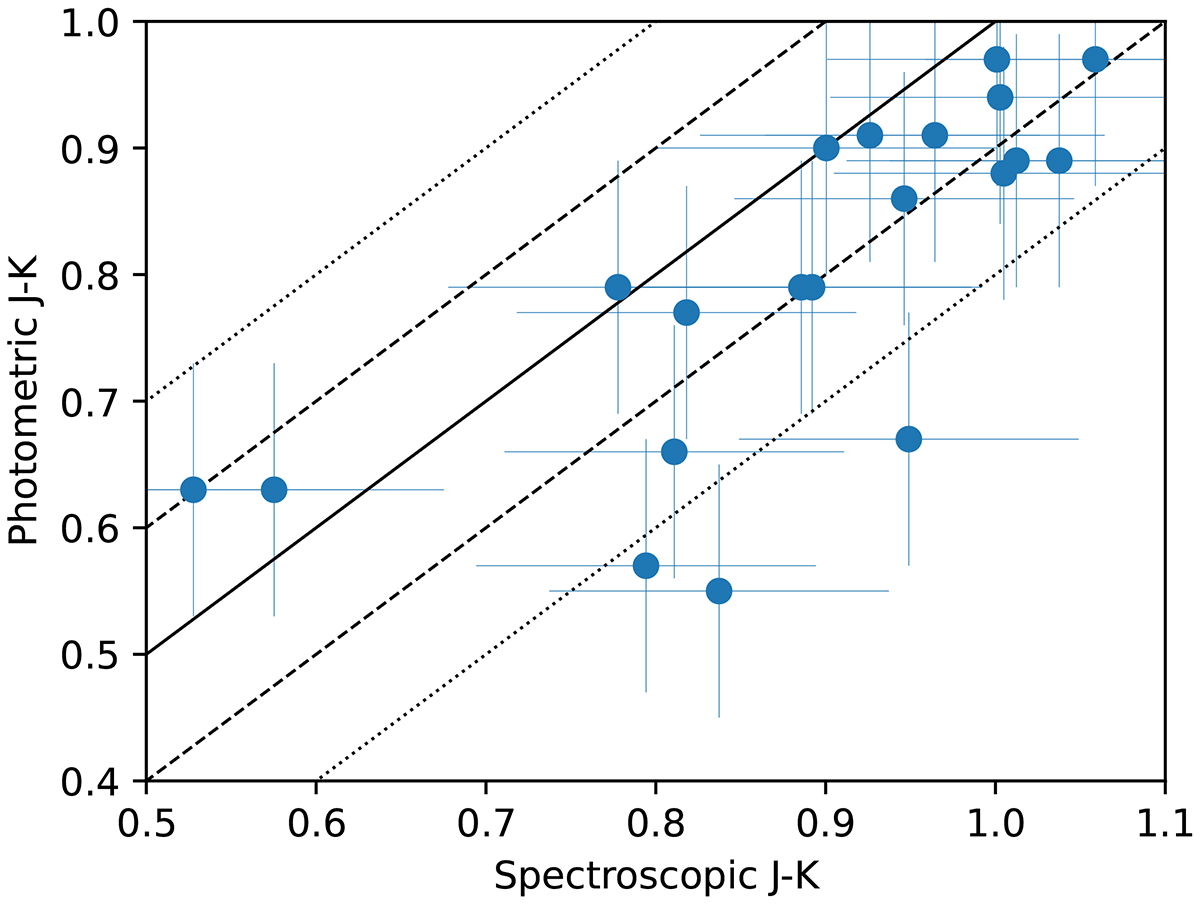
Comparison between J − K colours derived from our spectra with those derived from VISTA photometry. The solid line represents a perfect correlation. The dashed and dotted lines represent a deviation of 0.1 and 0.2 magnitudes from a perfect correlation, respectively. The anomalous/intermediate-age GC HGHH-G279 is not included in this plot because we were unable to derive its K-band photometry from its DECam data.
Current usage metrics show cumulative count of Article Views (full-text article views including HTML views, PDF and ePub downloads, according to the available data) and Abstracts Views on Vision4Press platform.
Data correspond to usage on the plateform after 2015. The current usage metrics is available 48-96 hours after online publication and is updated daily on week days.
Initial download of the metrics may take a while.