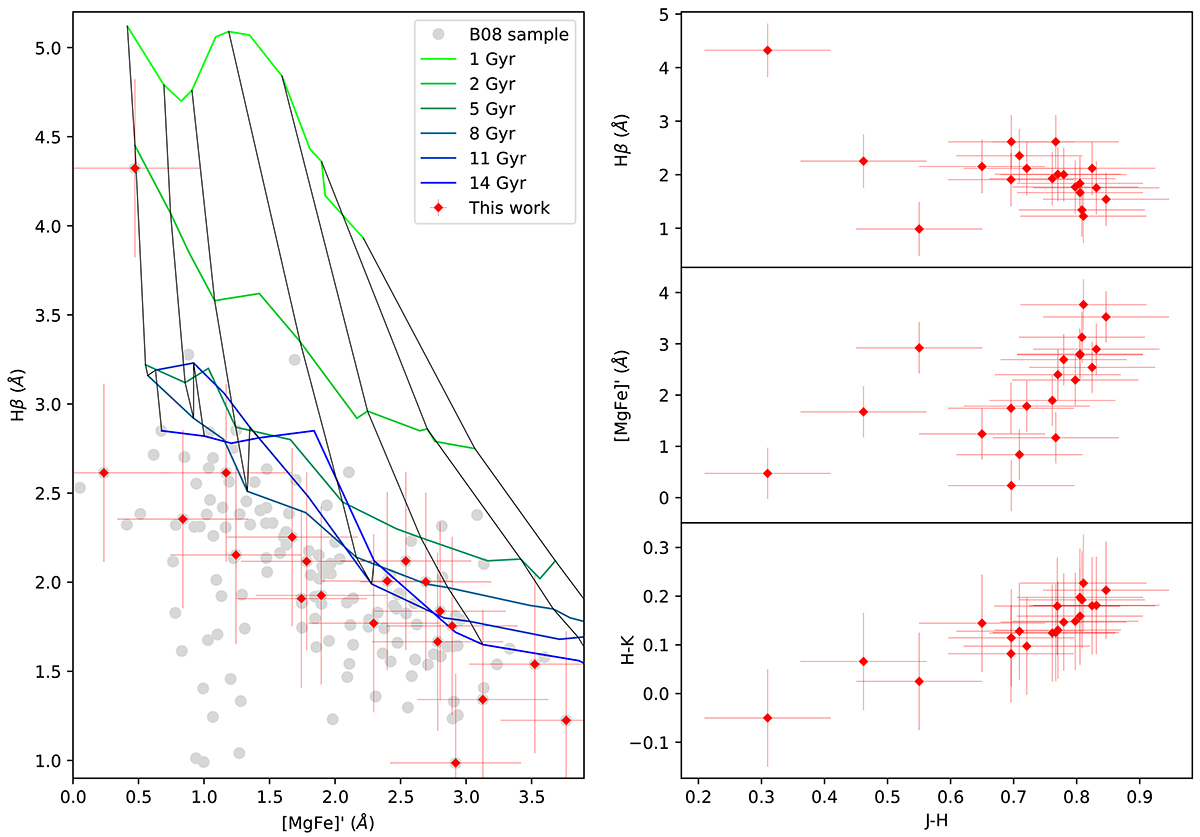
Fig. 1.
Download original image
Main properties for our sample. In the left panel, we show that our sample (red diamonds) covers Hβ and [MgFe]′ values from B08 (grey circles). For comparison, we overplot the Hβ × [MgFe]′ grid measured from the E-MILES model library. Different ages are represented using different colours, and the different metallicities are all represented in black (from left to right, the [M/H] tracks are equal to −2.27, −1.79, −1.26, −0.66, −0.25, +0.15, and +0.40). In the right panels, we show the correlations between J − H colours (x-axis) and Hβ (upper), [MgFe]′ (middle), and H − K colours (bottom panels). We plot the respective errors in all panels as red crosses over each respective diamond.
Current usage metrics show cumulative count of Article Views (full-text article views including HTML views, PDF and ePub downloads, according to the available data) and Abstracts Views on Vision4Press platform.
Data correspond to usage on the plateform after 2015. The current usage metrics is available 48-96 hours after online publication and is updated daily on week days.
Initial download of the metrics may take a while.