Fig. 9
Download original image
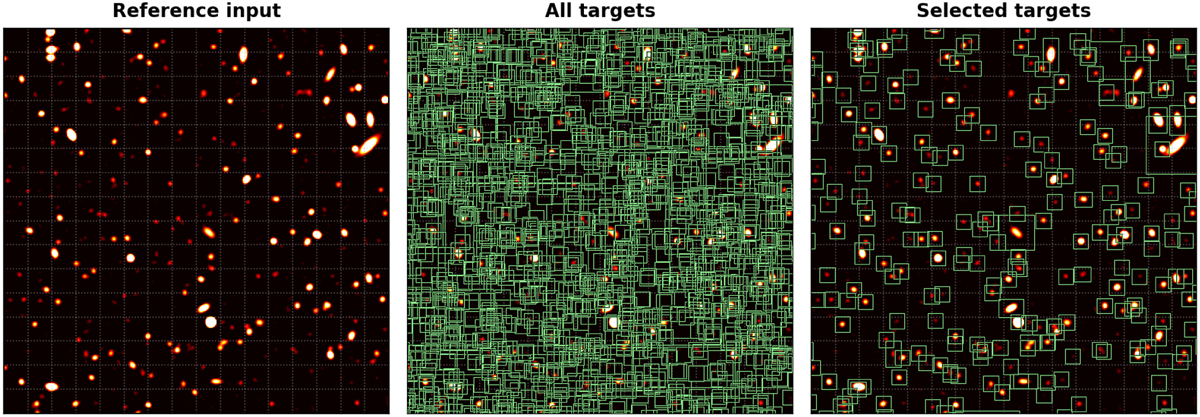
Illustration of the selection function over a typical input field. The background image represents an identical 256×256 input patch in all frames, centered on RA = 0.1 deg, Dec = −30.2 deg, using the renormalized input intensity but saturated at half the maximum value to increase visual contrast. The displayed grid corresponds to the detector output grid mapping for a network reduction factor of 16. The left frame is provided as an image reference, the middle frame represents all the target boxes from the True catalog, and the right frame represents the remaining target boxes after our selection function.
Current usage metrics show cumulative count of Article Views (full-text article views including HTML views, PDF and ePub downloads, according to the available data) and Abstracts Views on Vision4Press platform.
Data correspond to usage on the plateform after 2015. The current usage metrics is available 48-96 hours after online publication and is updated daily on week days.
Initial download of the metrics may take a while.