Fig. C.4
Download original image
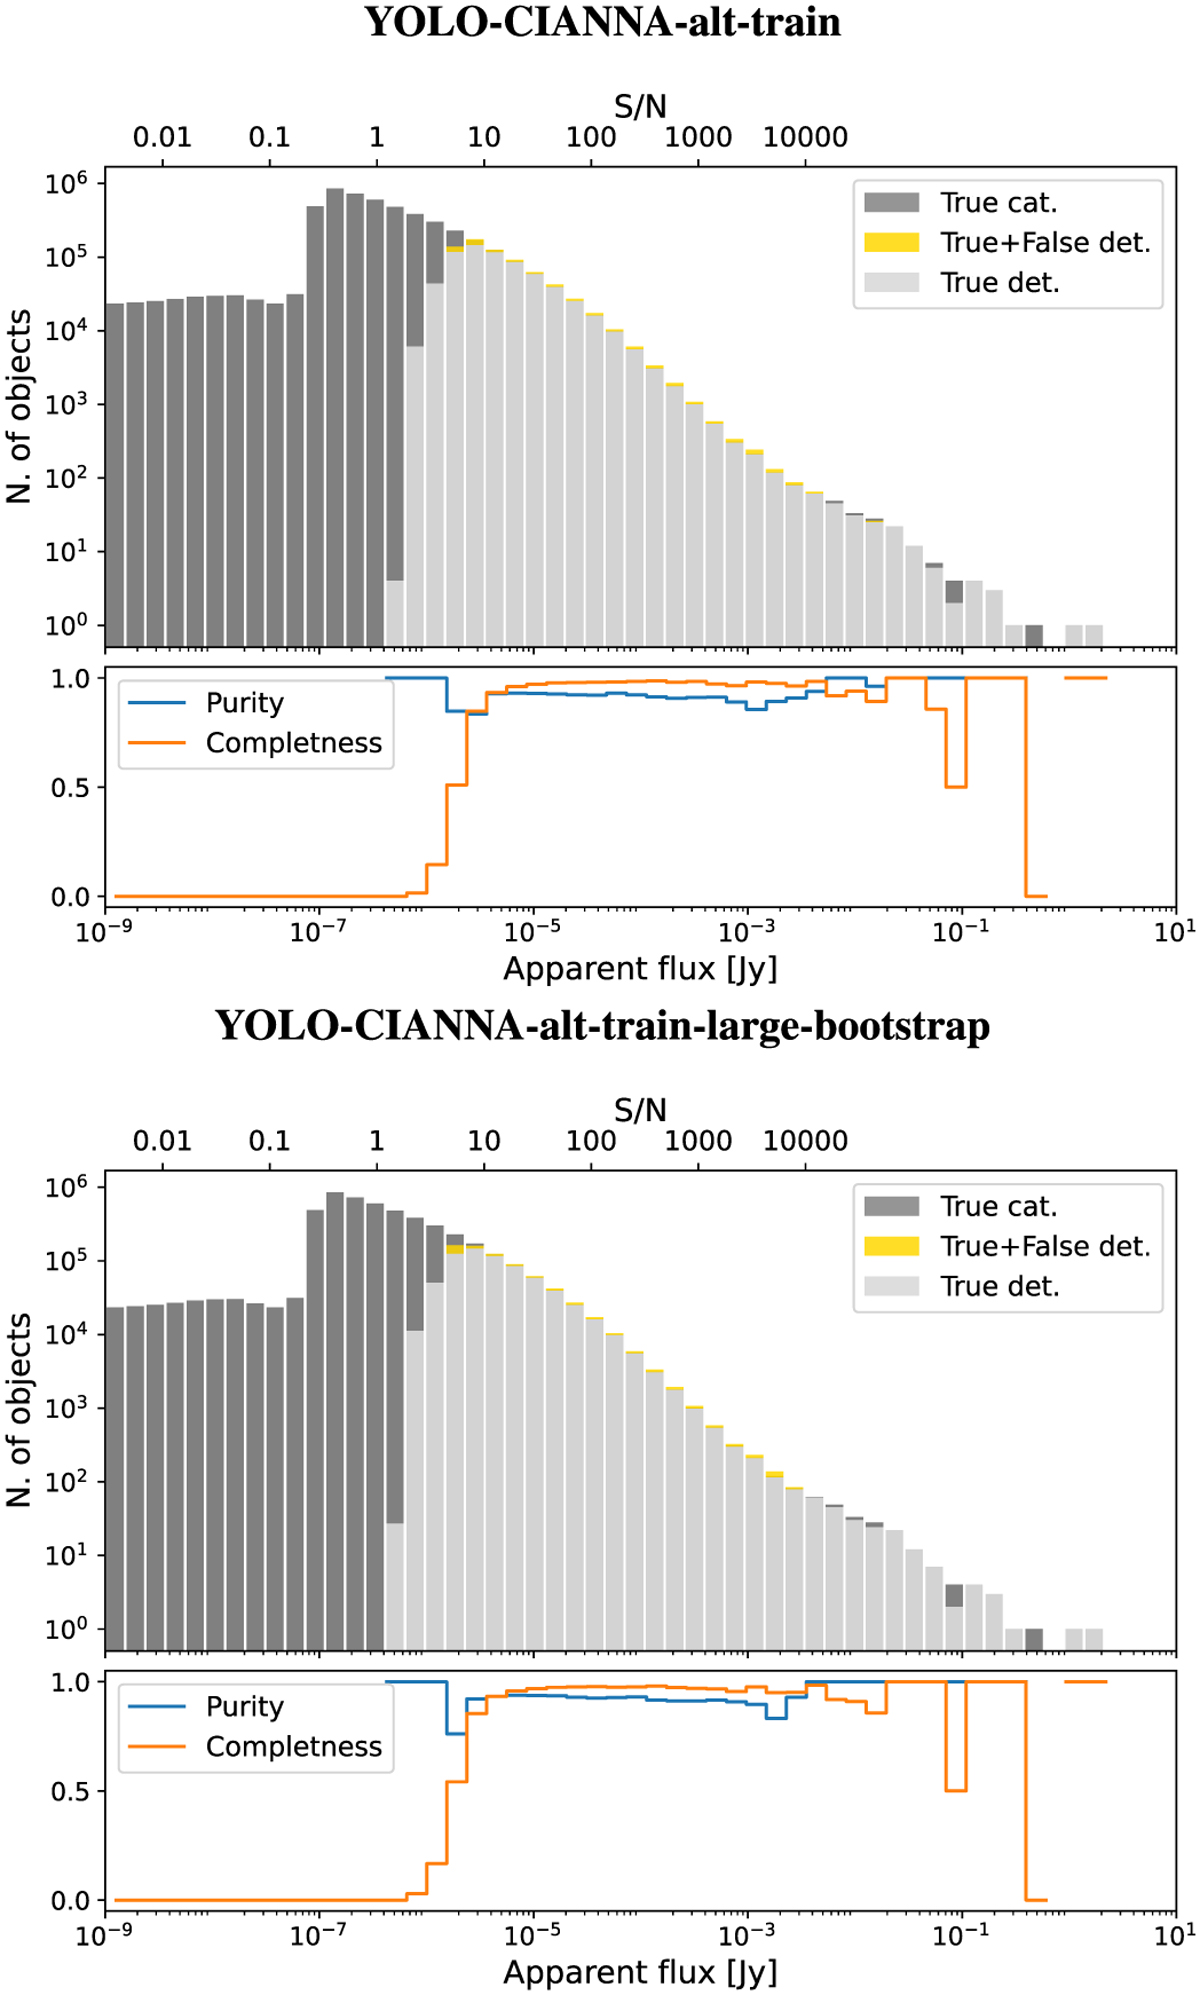
Histograms of the sources as a function of their apparent flux using logarithmic bins for the underlying True catalog and predicted sources in our modified testing area. The bottom part of each frame represents the purity and completeness of each bin of the histograms. Top and bottom frames represents the alt-train and alt-train-large-bootstrap models respectively.
Current usage metrics show cumulative count of Article Views (full-text article views including HTML views, PDF and ePub downloads, according to the available data) and Abstracts Views on Vision4Press platform.
Data correspond to usage on the plateform after 2015. The current usage metrics is available 48-96 hours after online publication and is updated daily on week days.
Initial download of the metrics may take a while.