Fig. 22
Download original image
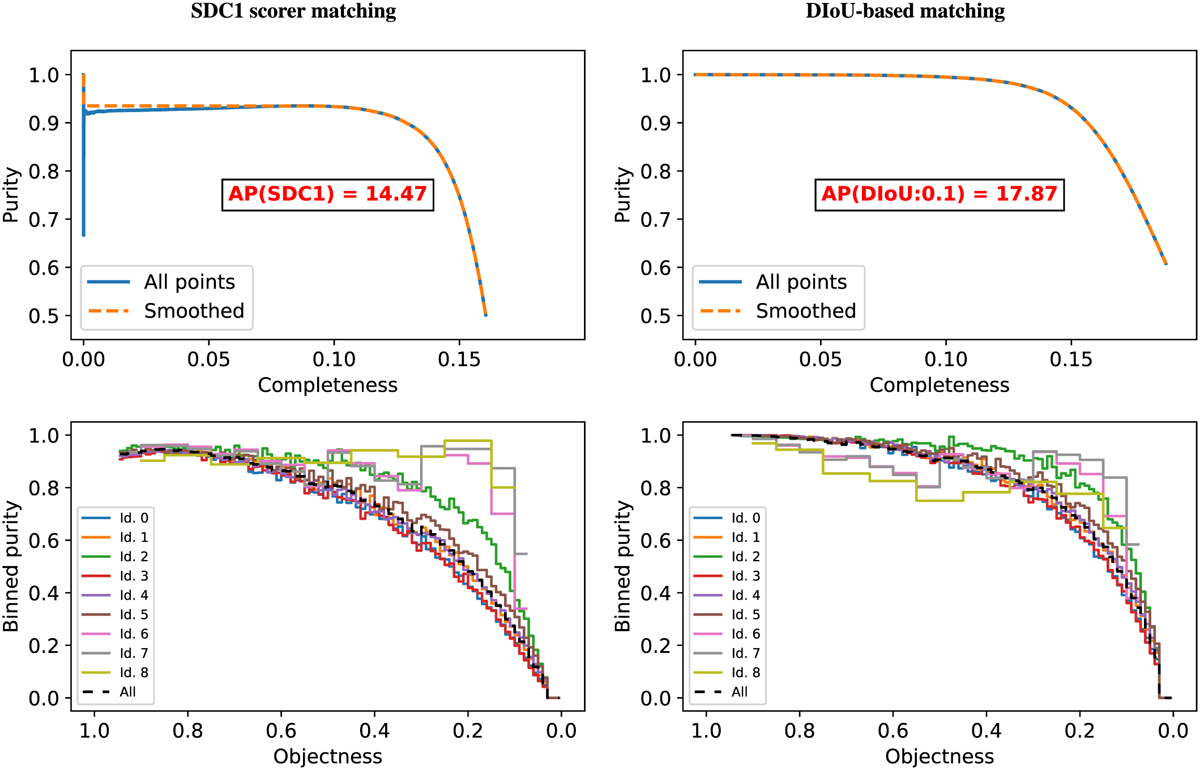
Detector sensitivity curves for the YOLO-CIANNA model. The top frames represent purity-completeness curves built from running purity and precision scores on an objectness-sorted prediction list. The smoothed version considers that the purity at any completeness point is the maximum purity at any superior completeness. The bottom frames represent the binned purity as a function of the objectness for each detection unit. The bin size is 0.01, 0.05, and 0.1 for the small, intermediate, and large size-prior regimes, respectively. The left and right columns present curves produced with the SDC1 scorer matching rule and a purely geometrical DIoU-based with a 0.1 threshold matching rule, respectively. All curves are produced from the same candidate catalog where all detections with an objectness less than 0.03 have been removed.
Current usage metrics show cumulative count of Article Views (full-text article views including HTML views, PDF and ePub downloads, according to the available data) and Abstracts Views on Vision4Press platform.
Data correspond to usage on the plateform after 2015. The current usage metrics is available 48-96 hours after online publication and is updated daily on week days.
Initial download of the metrics may take a while.