Fig. 19
Download original image
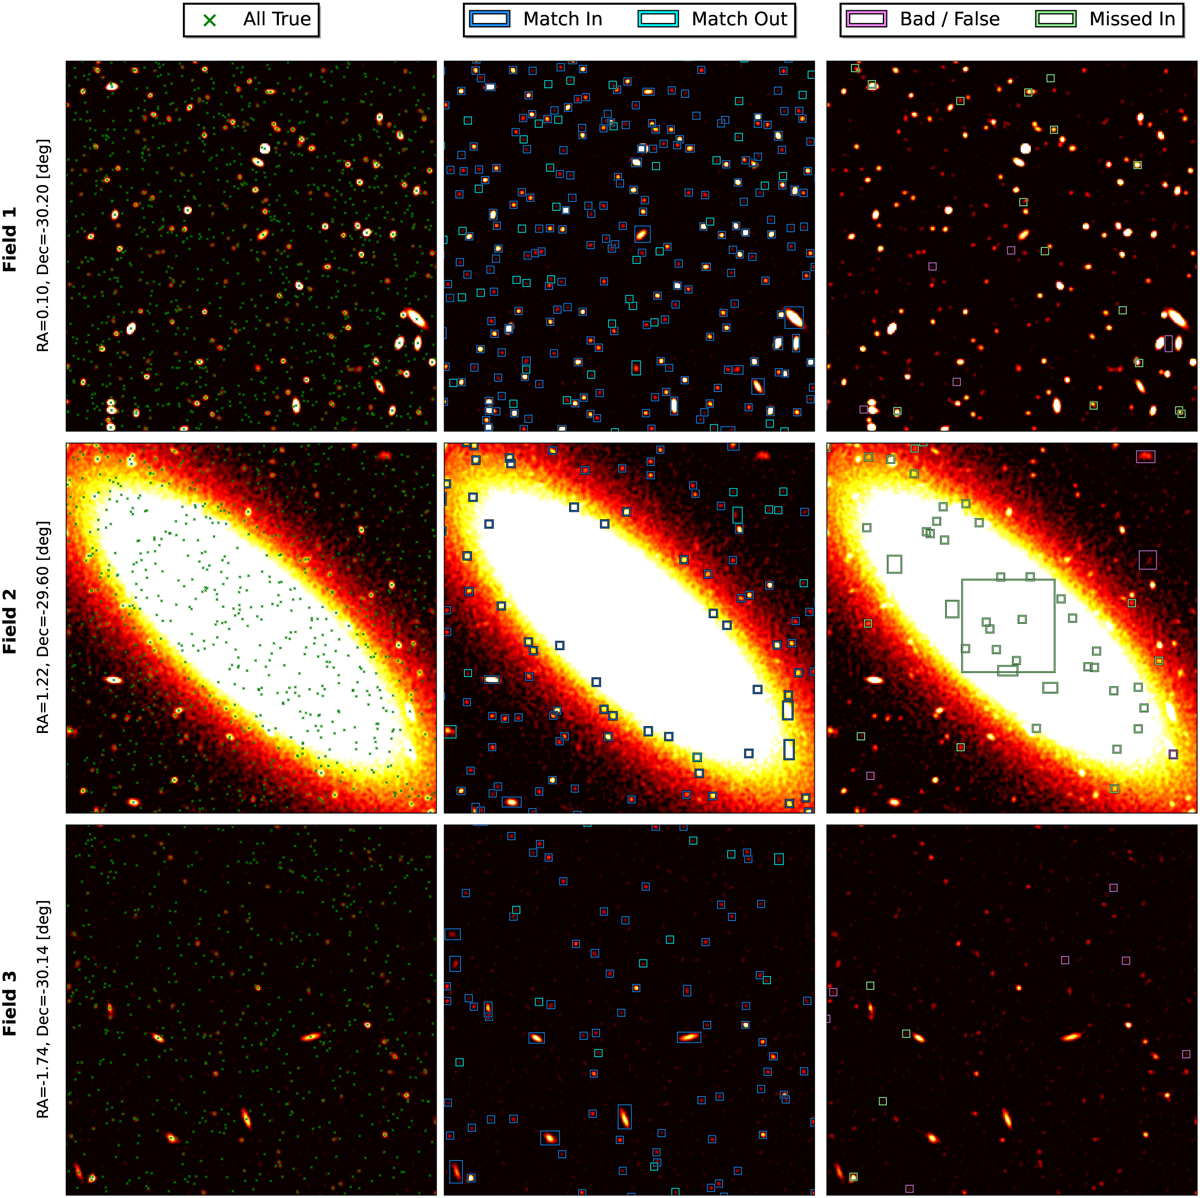
Distribution of sources and predictions for three 256 square pixels example fields. The background images use the same clipping and normalization as the network input (Sect. 3.7.1) but are saturated at 50% of the maximum. Each line represents a different field. Left: scatter plot of the central source coordinates from the full True catalog. Middle: boxes for predictions that match a true source based on the scorer. The match-out boxes indicate properly detected sources with a target flux below the minimum value in the training sample, so outside our selection function criteria (discussed in Sect. 4.2). Right: boxes for true sources that pass our selection function but are not detected, and boxes for predictions that are false positives based on the scorer.
Current usage metrics show cumulative count of Article Views (full-text article views including HTML views, PDF and ePub downloads, according to the available data) and Abstracts Views on Vision4Press platform.
Data correspond to usage on the plateform after 2015. The current usage metrics is available 48-96 hours after online publication and is updated daily on week days.
Initial download of the metrics may take a while.