Fig. 11
Download original image
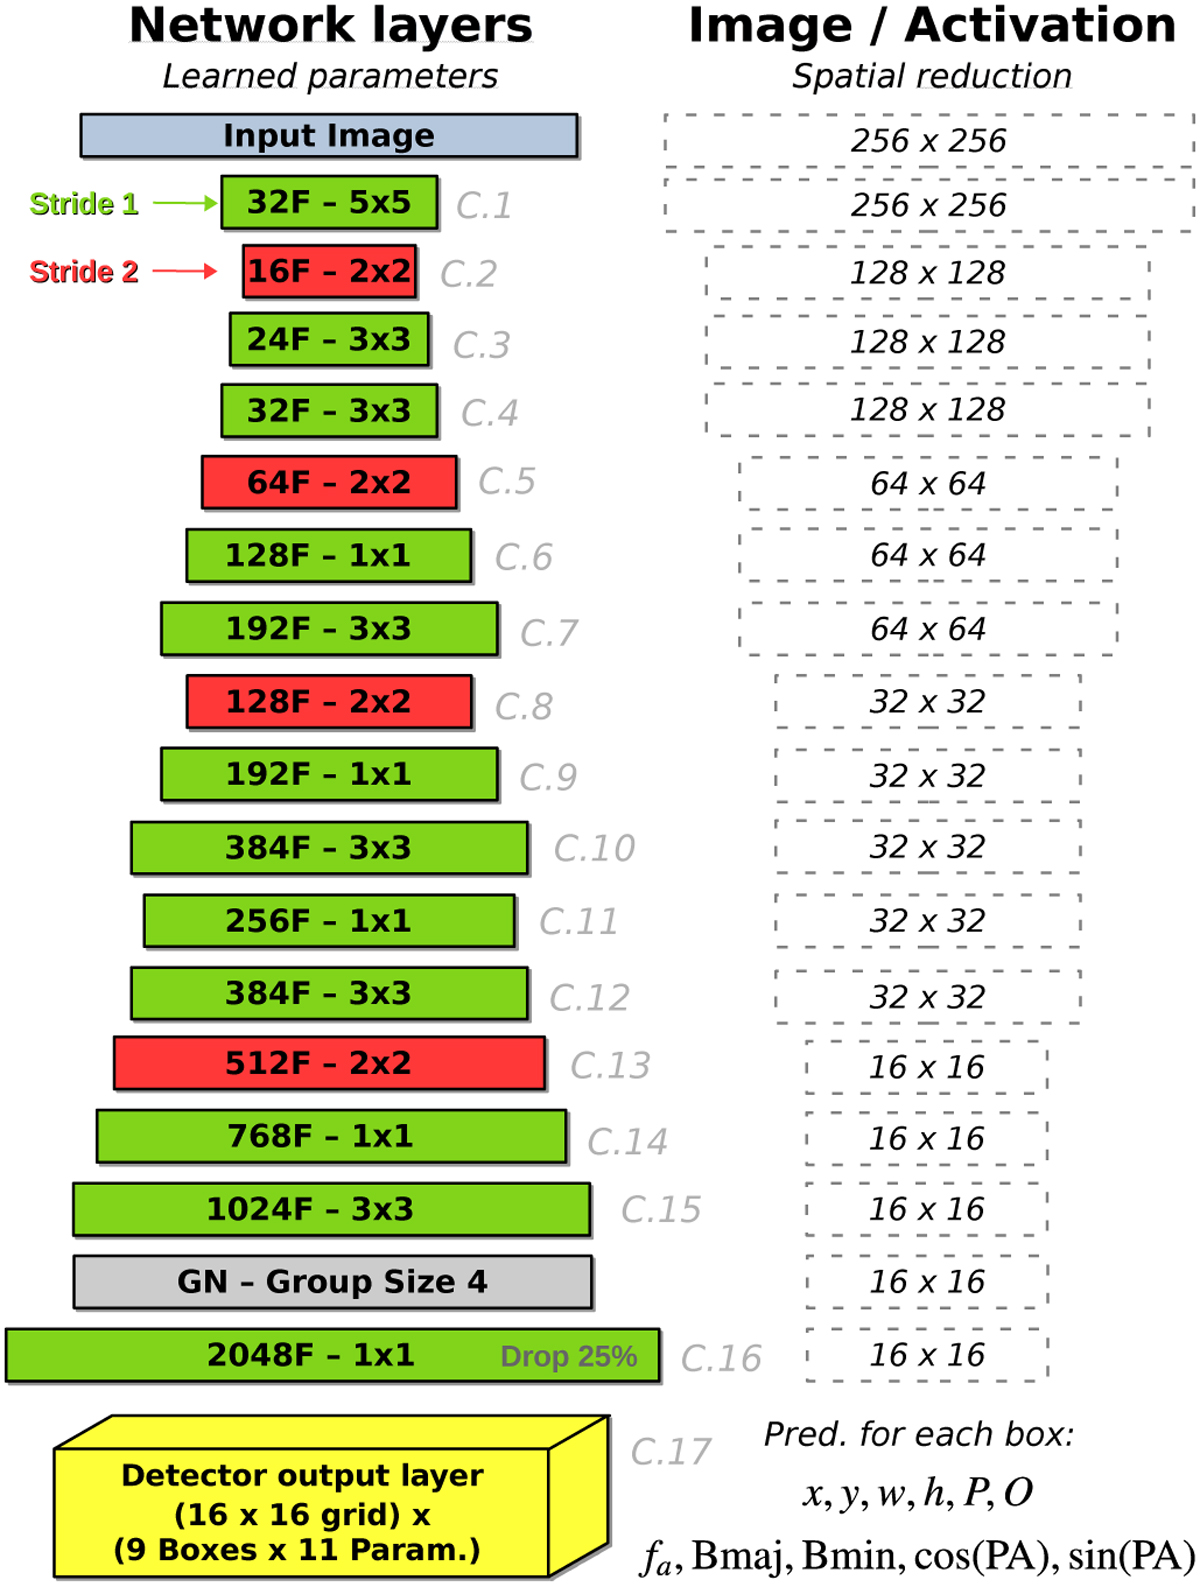
Illustration of our final CNN backbone architecture. The left column provides the layer structural properties, while the right column indicates the spatial output dimension for each layer starting from a 256×256 input size. The input image is on the top, and layers are stacked in order vertically. The width of a layer represents its number of filters. The green color indicates a layer that preserves the spatial dimension, while the red indicates a reduction. The output grid dimension and the list of the predicted parameters for each box are also indicated.
Current usage metrics show cumulative count of Article Views (full-text article views including HTML views, PDF and ePub downloads, according to the available data) and Abstracts Views on Vision4Press platform.
Data correspond to usage on the plateform after 2015. The current usage metrics is available 48-96 hours after online publication and is updated daily on week days.
Initial download of the metrics may take a while.