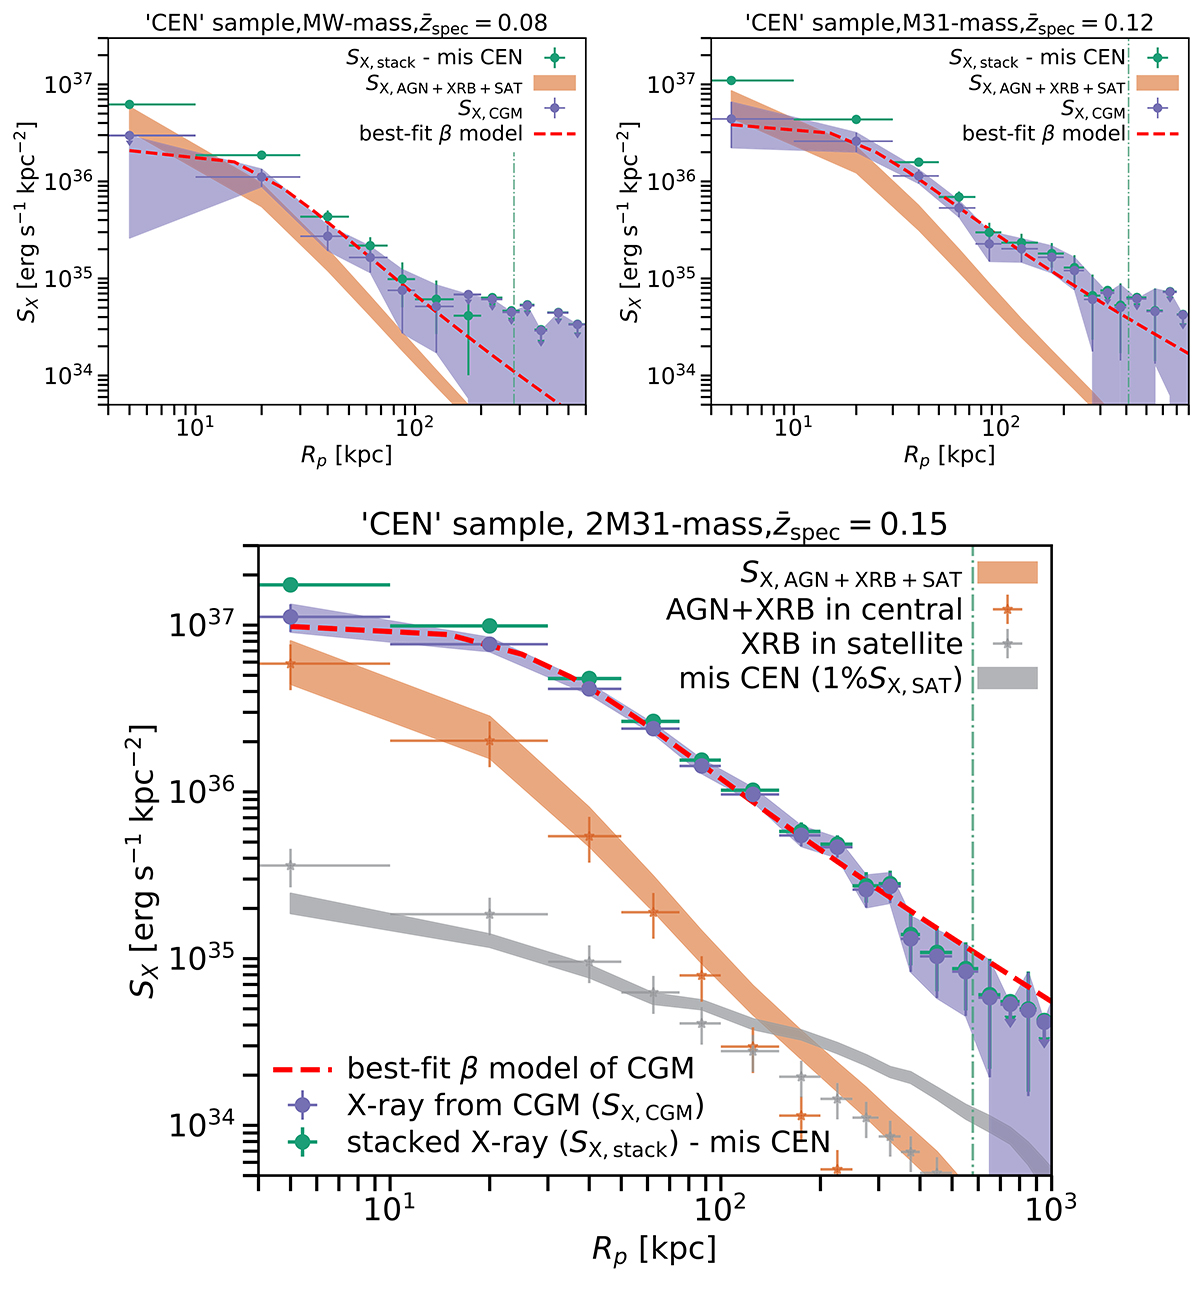
Fig. 5.
Download original image
Mean X-ray surface brightness profiles of central galaxies selected from SDSS in different M* bins, after masking X-ray sources and correction of misclassified centrals (green points, SX, stack), the total X-ray surface brightness of unresolved AGN and XRB in the stacked galaxies and satellites (orange band), and the X-ray surface brightness of the CGM (purple band, SX, CGM) modeled by subtracting the unresolved AGN and XRB from the SX, stack (See Sect. 4.4 for details). The red dashed line is the best-fit of the CGM profile with a β model. The vertical dash-dotted line is the virial radius, Rvir. The top two panels are for MW-mass and M31-mass galaxies, and the bottom panel is for 2M31-mass galaxies. In the bottom panel, we further denote the X-ray surface brightness profiles of modeled unresolved AGN and XRB in the central galaxies (orange cross), XRB in the satellite galaxies (gray cross), and X-ray surface brightness profile of misclassified satellite (gray band).
Current usage metrics show cumulative count of Article Views (full-text article views including HTML views, PDF and ePub downloads, according to the available data) and Abstracts Views on Vision4Press platform.
Data correspond to usage on the plateform after 2015. The current usage metrics is available 48-96 hours after online publication and is updated daily on week days.
Initial download of the metrics may take a while.