| Issue |
A&A
Volume 689, September 2024
|
|
|---|---|---|
| Article Number | A193 | |
| Number of page(s) | 6 | |
| Section | Extragalactic astronomy | |
| DOI | https://doi.org/10.1051/0004-6361/202451168 | |
| Published online | 13 September 2024 | |
Gas-phase metallicity for the Seyfert galaxy NGC 7130
1
Department of Physics, University of Arkansas, 226 Physics Building, 825 West Dickson Street, Fayetteville, AR 72701, USA
2
Instituto de Astrofísica de Canarias, E-38205 La Laguna, Tenerife, Spain
3
Departamento de Astrofísica, Universidad de La Laguna, E-38200 La Laguna, Tenerife, Spain
4
Dipartimento di Fisica e Astronomia, Universitá degli Studi di Firenze, Via G. Sansone 1, 50019 Sesto Fiorentino, Firenze, Italy
5
INAF – Osservatorio Astrofisico di Arcetri, Largo E. Fermi 5, 50125 Firenze, Italy
Received:
18
June
2024
Accepted:
13
July
2024
Abstract
Metallicity measurements in galaxies can provide valuable clues about galaxy evolution. One of the mechanisms postulated for metallicity redistribution in galaxies is gas flows induced by active galactic nuclei (AGNs), but the details of this process remain elusive. We report the discovery of a positive radial gradient in the gas-phase metallicity of the narrow-line region of the Seyfert 2 galaxy NGC 7130, which is not found when considering the star-forming (SF) components in the galaxy disc. To determine gas-phase metallicities for each kinematic component, we used both AGN and SF strong-line abundance relations, as well as Baldwin–Phillips–Terlevich diagnostic diagrams. These relations involve sensitive strong emission lines, namely [O III]λ5007, [N II]λ6584, Hα, Hβ, [S II]λ6716, and [S II]λ6731, observed with the adaptive-optics-assisted mode of the Multi Unit Spectroscopic Explorer at the Very Large Telescope. The presence of a positive radial metallicity gradient in only the ionised AGN component suggests that metals may be transported from central areas of a galaxy to its purlieus by AGN activity.
Key words: galaxies: abundances / galaxies: active / galaxies: evolution / galaxies: ISM / galaxies: nuclei / galaxies: Seyfert
Corresponding author; This email address is being protected from spambots. You need JavaScript enabled to view it. .
© The Authors 2024
 Open Access article, published by EDP Sciences, under the terms of the Creative Commons Attribution License (https://creativecommons.org/licenses/by/4.0), which permits unrestricted use, distribution, and reproduction in any medium, provided the original work is properly cited.
This article is published in open access under the Subscribe to Open model. This email address is being protected from spambots. You need JavaScript enabled to view it. to support open access publication.
1. Introduction
Metallicity is one of the most revealing physical quantities in the study of galaxy evolution (Maiolino & Mannucci 2019). Metals are produced in galaxies and returned to the interstellar medium (ISM) through a variety of mechanisms, such as supernova explosions (Hillebrandt & Niemeyer 2000; Woosley et al. 2002), neutron star mergers (Thielemann et al. 2017), and the ejection of gas by asymptotic giant branch stars (e.g. van Winckel 2003). The gas-phase metallicity of galaxies is impacted by various processes in galaxy evolution, including star formation, gas accretion, gas flows, and wind-driven outflows of gas from galaxies caused by supernova or active galactic nucleus (AGN) activity (e.g. Moustakas et al. 2011; Cresci et al. 2012; Sommariva et al. 2012), and it correlates with physical properties such as the star formation rate (Mannucci et al. 2010; Lara-López et al. 2010), stellar mass, and morphology (Edmunds & Pagel 1984).
In studies of galaxy formation and evolution, the distribution of metals plays an essential role (Sánchez Almeida et al. 2014). Metallicity gradients in galaxies are most often observed to be negative (i.e. decreasing metallicity with increasing radius) but sometimes exhibit a positive or flat behaviour. The presence of a negative gradient with a higher metallicity towards the nucleus indicates that star formation begins in the centre of a galaxy and expands outwards (Matteucci & Francois 1989). If galaxies evolve as a closed system and originate from the inside out, negative abundance gradients are expected (e.g. Mollá & Díaz 2005; Franchetto et al. 2020). This is common in the discs of most spiral galaxies (Kennicutt et al. 2003). Three major surveys have significantly increased the sample of metallicity gradient measurements in the local Universe, namely CALIFA (Calar Alto Legacy Integral Field Area; Sánchez et al. 2012), MaNGA (Mapping nearby Galaxies at Apache Point Observatory; Bundy et al. 2015), and SAMI (Sydney-AAO Multi-Object Integral-field spectrograph; Bryant et al. 2015). The results of these observations reveal that metallicity gradients are primarily negative in nearby galaxies.
A positive metallicity gradient, by contrast, has been observed in several other galaxies (e.g. Cresci et al. 2010; Queyrel et al. 2012; Belfiore et al. 2017; Carton et al. 2018; Wang et al. 2019; Mingozzi et al. 2020; Simons et al. 2021). In a simple scenario, galaxies develop and grow in a dense environment, with gas flowing through, around, and within them (Somerville & Davé 2015). Each of the events that make up this cycle, for example modified star formation, accretion, and mergers, has a unique impact on the galaxy. If metal-poor gas accretion is deposited directly into their centres, resulting in a break in the gradients at small galactocentric distances, the central metallicity of galaxies should be diluted and positive gradients should be observed. Storchi-Bergmann & Schnorr-Müller (2019) show that the capture of a gas-rich dwarf galaxy, which is a process that can start nuclear activity in galaxies, can result in the accretion of metal-poor gas into the nuclear region and its dilution. In a high-redshift investigation of star-forming (SF) galaxies, Queyrel et al. (2012) observed positive metallicity gradients and proposed that the inversion of the abundance gradient might be caused by interactions with the environment.
Metallicity gradients can also be flat. For example, do Nascimento et al. (2022) demonstrate that almost 10% of the MaNGA AGNs they studied are consistent with a constant metallicity across the galactic disc.
In addition to star formation, stellar evolution, and environmental influences, the presence of an AGN may have an impact on the evolution of the host galaxy properties (e.g. Groves et al. 2006; Coil et al. 2015; Thomas et al. 2019; Armah et al. 2023). The metal enrichment due to AGNs could be due to either an in situ top-heavy initial mass function in the accretion disc around the supermassive black hole (e.g. Nayakshin & Sunyaev 2005) or dust destruction in the broad-line region (BLR), which releases metals into the ISM (Maiolino & Mannucci 2019). In this case, following Maiolino & Mannucci (2019), the AGN would promote fast star formation and ISM enrichment.
Ionised gas outflows detected through optical emission lines are frequently observed in the narrow-line regions (NLRs) and the extended NLRs (e.g. Veilleux & Osterbrock 1987; Unger et al. 1987; Pogge 1988). Information gleaned from NLR outflows is valuable for studies of the interaction between AGNs and their host galaxies. The high-resolution capabilities of modern telescopes can resolve the NLRs of nearby galaxies within just a few parsecs of the supermassive black hole, and such telescopes can observe their extension over several kiloparsecs into the bulges and/or discs of the host galaxies (Kang & Woo 2018). The kinematics and physical conditions of the ionised gas in the NLR provide unique information regarding the properties of the outflows, including the energy associated with them (e.g. Bennert et al. 2006; Vaona et al. 2012; Dopita et al. 2014; Chen et al. 2019; Zhang 2022; Meena et al. 2023). The NLR would then be further enhanced by AGN-driven outflows of high-metallicity gas that has been ejected from the BLR on kiloparsec scales (e.g. D’Odorico et al. 2004). In situ star formation within AGN-driven outflows is another potential contribution to the metal enrichment of the gas around the BLR (e.g. Maiolino et al. 2017; Gallagher et al. 2019).
For the first time, we have studied, separately, the metallicity gradients in the disc and the low- and high-velocity dispersion components of NGC 7130 by using the multi-component fits of the emission lines performed in Comerón et al. (2021). The paper is organised as follows. In Sect. 2 we provide a brief overview of the galaxy areas used in our study. In Sect. 3 we outline how we classified the data into AGN and SF regions. We also elaborate on the calibration relations employed to estimate the gas-phase metallicities and their variations as a function of radial distance. Finally, in Sect. 4 we discuss our findings, summarising the implications and significance of our study.
2. Observational data
The southern galaxy NGC 7130 has a redshift of z = 0.016151. With an axial ratio of 0.88, this galaxy is almost face-on (Skrutskie et al. 2006). It is a peculiar Sa galaxy (de Vaucouleurs et al. 1991) with a bar (e.g. Mulchaey et al. 1997; Malkan et al. 1998; Dopita et al. 2002; Marín et al. 2010; Zhao et al. 2016) and shows evidence of an ionised outflow (Knapen et al. 2019). NGC 7130 also hosts a Seyfert 2 AGN (Phillips et al. 1983). Radio and optical investigations suggest that both star formation and nuclear activity contribute to ionising the gas in the nuclear region.
The optical spectrum of NGC 7130 shows narrow (low-velocity dispersion, σ < 250 km s−1) and broad kinematic components (high-velocity dispersion, σ > 250 km s−1) that correspond to both ambient and outflowing gas in the galaxy (Knapen et al. 2019; Comerón et al. 2021). Knapen et al. (2019) and Comerón et al. (2021) used high-angular-resolution optical integral field spectroscopy (7.5 × 7.5 arcsec2 field of view, and the point source function has a full width at half maximum of about 0.18 arcsec) obtained with the adaptive-optics-supported Multi Unit Spectroscopic Explorer (MUSE) instrument on the European Southern Observatory (ESO) Very Large Telescope (VLT).
In this study, we used information from the multi-component decomposition of the circumnuclear ISM of NGC 7130 from Comerón et al. (2021), which is based on the principal MUSE-wavelength emission lines. Each of the spectral lines was fitted with a superposition of up to six Gaussian components with distinct velocities and velocity dispersions. The fit was made using the python re-implementation of the GandALF software (called pyGandALF; Sarzi et al. 2006; Falcón-Barroso et al. 2006; Bittner et al. 2019) over 2689 spectral bins with a signal-to-noise ratio of the Hα line of 100 or more generated using the Voronoi binning algorithm from Cappellari & Copin (2003). To reduce the number of free parameters, the kinematics of different emission line components were tied to those of the Hα line. The number of components required for a given spectrum was chosen based on criteria using the χ2 goodness-of-fit estimator (see the flow chart in Fig. 3 of Comerón et al. 2021). In total, nine distinct kinematic components were characterised.
Six of the nine kinematic components found by Comerón et al. (2021) are associated with the AGN outflow. Their nature was deduced from their high velocities with respect to the galaxy (typically hundreds of km s−1), their relatively large velocity dispersion (of hundreds of km s−1 or more), and line ratios incompatible with an ionisation by stars. These AGN-related components can be further subdivided into kinematically narrow components (typical velocity dispersion below 250 km s−1) and kinematically broad components (typical velocity dispersion above 250 km s−1). A further two of the nine kinematic components of the circumnuclear medium in NGC 7130 are related to the disc. The final component might be an artefact caused by the fitting procedure.
Based on their observations, Comerón et al. (2021) produced a toy model of the circumnuclear medium of NGC 7130 (see their Fig. 14). They propose that the ISM in the disc has a low-density (ne ≈ 90 cm−3), low-velocity-dispersion (σ < 100 km s) background on top of which we observe a higher-density (ne ≈ 500 cm−3), slightly blueshifted (−100 km s−1 < V < 0 km s−1), and slightly higher-velocity-dispersion (σ < 250 km s−1) gas associated with the strongest knots of star formation; this gas is called the narrow zero-velocity component to distinguish it from kinematically narrow components in the outflow. The AGN outflow is postulated to have a biconical morphology with a main axis that is close to coplanar with the galaxy disc. Each of the cones is thought to be made up of one or more collimated narrow components, and surrounded by a broad component with a larger opening angle. The blueshifted components would correspond to the approaching side of the bicone (located slightly above the plane of the galaxy), whereas the redshifted ones would correspond to the receding one (located below the mid-plane). According to the model, the redshifted side of the cone is partly obscured by extinction from the disc, and hence parts of it are not observed or are seen at a lower signal-to-noise level than their blueshifted counterparts. Hence, the properties derived for the redshifted components of the outflow are more uncertain than those derived for the blueshifted components.
In this study, we considered four of the nine components from Comerón et al. (2021), namely the gas-phase metallicity in the disc and the broad blueshifted, narrow blueshifted, and narrow zero-velocity components. The reason for excluding the redshifted high- and low-velocity dispersion components is ultimately that the redshifted components are obscured by the disc, so it is harder to obtain precise gas-phase metallicity measurements. The zero-velocity high-velocity dispersion component is probably a spurious artefact required to fit the spectra in some of the bins. We also did not investigate the crescent low-velocity dispersion component because this region combines the interaction of the jet and disc, and there is no clear method for calculating the metallicity in these complex regions.
3. Results
To classify regions in NGC 7130 as AGN-ionised or H II-ionised, we used the standard Baldwin–Phillips–Terlevich (BPT) diagrams (Baldwin et al. 1981) applied to the spectra of each of the Voronoi bins defined by Comerón et al. (2021). The distribution of the bins in the [O III] 5007/Hβ versus [N II]6584/Hα diagram, together with the boundary lines between SF and AGN regions defined by Kewley et al. (2001) and Kauffmann et al. (2003), is shown in Fig. 1. The red demarcation line (Kewley et al. 2001) is a theoretical upper limit on the location of SF galaxies in this diagram, obtained using a combination of photoionisation and stellar population synthesis models. It yields a conservative selection of AGNs. Kauffmann et al. (2003) revised this boundary line on the basis of observational evidence that SF regions and AGNs are distributed along two separate sequences. It yields a conservative SF region selection. To avoid ambiguous classifications, we adopted the more conservative selection for both SF regions and AGNs, excluding from further consideration the bins located between the two lines. They could include regions with a mixture of ionising sources (e.g. Allen et al. 2008; Rosa et al. 2021) and are expected to have a mixed AGN-stellar emission as their ionising source (e.g. Davies et al. 2014). Figure 1 presents a diagnostic BPT diagram of the distribution of AGN and SF bins through each component. We find that the disc component is partly ionised by SF and AGN regions, whereas the other three components (outflows) are dominated by AGN photoionisation.
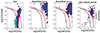 |
Fig. 1. BPT diagnostic diagram to discriminate between SF- and AGN-ionised regions. The dashed black line and the solid red line show the separations between the two populations according to the boundaries from Kewley et al. (2001) and Kauffmann et al. (2003), respectively. Circles and blue stars mark AGN- and SF-dominated regions, respectively. Plots are colour-coded according to how far bins are from the centre. We have not investigated the regions located between the two lines (purple circles). |
3.1. Gas-phase metallicity estimation
The gas-phase metallicity in each bin was calculated using calibrations based on strong emission lines, that is to say, by adopting the so-called strong-line method. The MUSE wavelength coverage and the laser-affected wavelength (contamination caused by a laser beam during adaptive optics observations) prevented us from measuring the temperature-sensitive emission lines, [O III]λ4363 and [N II]λ5756, and thus from estimating element abundances using the direct method (Te). While we are able to identify [O II]λλ7319,7330 in the majority of bins, the doublet [O II]λλ3720,3730 fell outside the MUSE wavelength range, making it impossible to calculate abundances based on these auroral lines. We are aware of the systematic discrepancies in gas-phase metallicities that are potentially present when using strong-line methods: differences of up to 0.6 dex for H II regions (e.g. Kewley & Ellison 2008; López-Sánchez et al. 2012; Peña-Guerrero et al. 2012) and up to 0.8 dex for AGNs can be found when comparing metallicities obtained using the strong-line method based on calibrations from different authors, particularly in the low-metallicity regime (less than 8.5; e.g. Dors et al. 2019).
To estimate gas-phase metallicities, we utilised the emission-line intensities of [O III]λ5007, [N II]λ6584, Hα, Hβ, [S II]λ6716, and [S II]λ6716. We discarded the bins where one or more of these emission lines are not detected. We considered two different calibration relations to estimate the gas-phase metallicities for SF- and AGN-dominated regions. Hereafter, we refer to the gas-phase metallicity as Zgas. For SF regions, we utilised the methodology developed by Curti et al. (2017) to determine the Zgas. Curti et al. (2017) introduced novel empirical calibrations specifically designed for a selection of commonly employed strong-line diagnostics, and the scatter around the calibration varies by up to 0.15. These calibrations enable accurate calculations of the oxygen abundance in SF galaxies and allowed us to estimate the Zgas in SF regions. Following Curti et al. (2017), we defined
![Mathematical equation: $$ \begin{aligned} \mathrm{N2}&= {[\mathrm{N}\,ii ]\lambda 6584/\mathrm{H}\beta }, \end{aligned} $$](/articles/aa/full_html/2024/09/aa51168-24/aa51168-24-eq1.gif) (1)
(1)
![Mathematical equation: $$ \begin{aligned} \mathrm{S2}&= ({[\mathrm{S}ii ]\lambda 6716+[\mathrm{S}ii ]\lambda 6730)/\mathrm{H}\beta },\end{aligned} $$](/articles/aa/full_html/2024/09/aa51168-24/aa51168-24-eq2.gif) (2)
(2)
![Mathematical equation: $$ \begin{aligned} \mathrm{R3}&= {[\mathrm{O}iii ]\lambda 5007/\mathrm{H}\beta }, \end{aligned} $$](/articles/aa/full_html/2024/09/aa51168-24/aa51168-24-eq3.gif) (3)
(3)
and calculated the Zgas for a given SF region following
 (4)
(4)
for log10(N2) > − 0.6 and
 (5)
(5)
for log10(N2)≤ − 0.6.
To compute gas-phase metallicities in AGN regions, we used the relation from Storchi-Bergmann et al. (1998): We first calculated the Zgas and the intensities of optical emission-line ratios of AGNs that are valid for the Zgas in the range 8.4 ≤ Zgas ≤ 9.4. The Zgas computed from these calibrations vary by ∼0.1 dex. The metallicity value was corrected in order to take electron density (Ne) effects into account via:
 (6)
(6)
in which
 (7)
(7)
To estimate the Ne, we adopted the Comerón et al. (2021) measurements, which mainly used the total [S II]λ6716 and [S II]λ6730 flux ratio calibration from Sanders et al. (2016). A histogram of each component’s variations in Zgas (from the AGNs and SF regions combined) is shown in Fig. 2, while Fig. 3 shows the spatial distribution (X, Y) of the AGN and SF bins. We excluded a small number of data points (fewer than ten bins) for each component where Zgas ≤ 8.2.
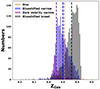 |
Fig. 2. Distribution of Zgas for the four components described Sect. 2. The vertical dashed lines show the median value of Zgas for each of the components. |
3.2. Radial variations in Zgas
An increasing amount of observational data supports the existence metal-rich outflows from AGN-powered winds and/or jets (McNamara & Nulsen 2012). Cold gas that is highly enriched in metals has recently been discovered in various clusters and groups (e.g. Mishra & Muzahid 2022). This gas is either correlated with radio jets or found preferentially along cavities. Its abundance is generally near-solar or even super-solar, and in some cases it is even more enriched than the regions that are closest to the centre of galaxies (e.g. Simionescu et al. 2009; O’Sullivan et al. 2011; Kirkpatrick & McNamara 2015). Given the large amount of energy needed to move gas to its measured position, it is assumed that this metal-enriched gas was carried to its observed location by AGN-related processes (e.g. Simionescu et al. 2008; Pope et al. 2010; Kirkpatrick et al. 2011).
We derived radial chemical abundance profiles for the different components of NGC 7130, as shown in Fig. 4. We employed a binned linear regression approach to fit the radially averaged Zgas as a function of radial distances. In Table 1 we list the slopes and intercepts of the gradients down to the centre (R = 0) for each component. For the narrow and broad blueshifted components, we find an overall positive radial trend, which suggests a gradual increase in the Zgas as we move towards the outer regions. This finding implies that there must exist strong internal mechanisms within the galaxy that actively transport high amounts of metals towards these outer areas.
Radial distributions of Zgas.
The disc component (top-left panel in Fig. 3 and left panel in Fig. 4) is harder to interpret, as it shows a superposition of AGN- and SF-ionised regions. Since the axis of the AGN outflow is probably close to the plane of the disc (Comerón et al. 2021), it is possible that the AGN radiation is genuinely ionising parts of the disc. However, it is also possible that the bins ionised by the AGN are an artefact caused by the difficulty of measuring the intensity of the component of the [O III] lines corresponding to the disc (see Figs. A.1 and A.2 in Comerón et al. 2021 to appreciate how they can easily be buried under the components corresponding to the outflow). The parts of the disc ionised by the AGN tend to show a positive gradient for the radial Zgas.
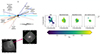 |
Fig. 3. Hubble Space Telescope F555W image of the central region of NGC 7130 superimposed on the MUSE-Narrow Field Mode(NFM) coverage area and the MUSE data cube integrated along the spectral direction (lower-left panel). The top-left panel illustrates the ionised circumnuclear gas in NGC 7130 using the toy model from Comerón et al. (2021). The right panel displays the spatial (X, Y) distribution of bins for four of the nine components in NGC 7130. The circles mark the AGNs determined based on the BPT classification, and stars mark SF regions. The coordinates are given in arcseconds in each panel, and the colour bar is for the Zgas. |
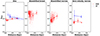 |
Fig. 4. Metallicity gradient profiles for each component using the Storchi-Bergmann et al. (1998) and Curti et al. (2017) metallicity relations for AGNs (red circles) and SF regions (blue stars), respectively, with the radius (in kpc) given on the bottom axis. Overplotted are binned linear fits to the radial metallicity gradient in AGNs (dotted red lines) and SF regions (dotted blue lines). The bigger dots mark the binned median values, and error bars represent the scatter in the data within each bin. |
For the SF bins in the disc (the narrow zero-velocity component), we also find a negative radial Zgas. This is in line with the notion that galaxies have relatively smooth gas accretion histories, with metal-poor inflows and outflows preferentially affecting the outer regions of galaxies. This, combined with the inside-out evolution of galaxies, naturally gives rise to a negative metallicity gradient (e.g. Boardman et al. 2023).
4. Conclusions
We have addressed the still unsettled issue of the radial distribution of gas-phase metallicities in AGNs by exploring the different gas components identified in NGC 7130 by Comerón et al. (2021). We distinguished between SF- and AGN-dominated bins by means of the classical BPT diagnostics. Depending on the type of emission lines that can be detected in both AGN and SF regions, studies have proposed various strong-line ratios to characterise the metallicities (e.g. Carvalho et al. 2020; Storchi-Bergmann et al. 1998; Pérez-Montero & Contini 2009; Curti et al. 2017). Depending the location in the BPT diagram, we computed gas-phase metallicities based on either the Curti et al. (2017) or Storchi-Bergmann et al. (1998) calibration relations. We then analysed the radial Zgas distribution for each component separately.
The majority of the gas-phase metallicities that we observe in the AGN component consistently increase with radius, meaning that the activity of the AGNs indeed plays a significant role in shaping the radial distribution of the Zgas. This suggests that AGN activity is responsible for actively transporting metals from the central region of a galaxy to its purlieus. This intriguing phenomenon could be at the root of the notably steep relationship between the radial distance from the galactic centre and the Zgas.
We find that for the AGN-ionised gas, the Zgas is lowest in the nuclear region. This piece of information potentially holds key insights into the environmental influences. The present AGN activity of NGC 7130 may be the result of a recent accretion from a metal-poor dwarf galaxy. Although there is no strong observational evidence of an interaction between NGC 7130 and its neighbouring galaxies, the warped aspect of the outskirts of NGC 7130 (de Vaucouleurs et al. 1976) may be the result of a past close encounter. Further signs of a possible recent interaction are the asymmetric velocity and velocity dispersion maps of the ionised gas in the galaxy (Bellocchi et al. 2012). As Storchi-Bergmann & Schnorr-Müller (2019) have shown, the capture of a gas-rich dwarf galaxy, which is a process that can start nuclear activity in galaxies, can result in the accretion of metal-poor gas into the nuclear region and its dilution.
To conclude, our findings emphasise the crucial role that AGN activity plays in shaping the metal enrichment of galaxies and provide valuable insights into the underlying processes driving the Zgas gradients in galaxies. Our work highlights the importance of internal mechanisms in redistributing metal content throughout a galaxy, from its centre to its outskirts.
Acknowledgments
A.A. thanks Kastytis Zubovas, C. Ramos Almeida, Rogério Riffel, and A.Khoram for helpful discussions. Also, A.A. acknowledges support from the ACIISI, Consejería de Economía, Conocimiento y Empleo del Gobierno de Canarias and the European Regional Development Fund (ERDF) under the grant with reference PROID2021010044. SC acknowledges funding from the State Research Agency (AEI-MCINN) of the Spanish Ministry of Science and Innovation under the grant ‘Thick discs, relics of the infancy of galaxies’ with reference PID2020-113213GA-I00. Co-funded by the European Union (MSCA EDUCADO, GA 101119830). Views and opinions expressed are however those of the author(s) only and do not necessarily reflect those of the European Union. Neither the European Union nor the granting authority can be held responsible for them. JHK acknowledges grant PID2022-136505NB-I00 funded by MCIN/AEI/10.13039/501100011033 and EU, ERDF.
References
- Allen, M. G., Groves, B. A., Dopita, M. A., Sutherland, R. S., & Kewley, L. J. 2008, ApJS, 178, 20 [Google Scholar]
- Armah, M., Riffel, R., Dors, O. L., et al. 2023, MNRAS, 520, 1687 [NASA ADS] [CrossRef] [Google Scholar]
- Baldwin, J. A., Phillips, M. M., & Terlevich, R. 1981, PASP, 93, 5 [Google Scholar]
- Belfiore, F., Maiolino, R., Tremonti, C., et al. 2017, MNRAS, 469, 151 [Google Scholar]
- Bellocchi, E., Arribas, S., & Colina, L. 2012, A&A, 542, A54 [NASA ADS] [CrossRef] [EDP Sciences] [Google Scholar]
- Bennert, N., Jungwiert, B., Komossa, S., Haas, M., & Chini, R. 2006, A&A, 456, 953 [NASA ADS] [CrossRef] [EDP Sciences] [Google Scholar]
- Bittner, A., Falcón-Barroso, J., Nedelchev, B., et al. 2019, A&A, 628, A117 [NASA ADS] [CrossRef] [EDP Sciences] [Google Scholar]
- Boardman, N., Wild, V., Heckman, T., et al. 2023, MNRAS, 520, 4301 [NASA ADS] [CrossRef] [Google Scholar]
- Bryant, J. J., Owers, M. S., Robotham, A. S. G., et al. 2015, MNRAS, 447, 2857 [Google Scholar]
- Bundy, K., Bershady, M. A., Law, D. R., et al. 2015, ApJ, 798, 7 [Google Scholar]
- Cappellari, M., & Copin, Y. 2003, MNRAS, 342, 345 [Google Scholar]
- Carton, D., Brinchmann, J., Contini, T., et al. 2018, MNRAS, 478, 4293 [NASA ADS] [CrossRef] [Google Scholar]
- Carvalho, S. P., Dors, O. L., Cardaci, M. V., et al. 2020, MNRAS, 492, 5675 [NASA ADS] [CrossRef] [Google Scholar]
- Chen, J., Shi, Y., Dempsey, R., et al. 2019, MNRAS, 489, 855 [CrossRef] [Google Scholar]
- Coil, A. L., Aird, J., Reddy, N., et al. 2015, ApJ, 801, 35 [Google Scholar]
- Comerón, S., Knapen, J. H., Ramos Almeida, C., & Watkins, A. E. 2021, A&A, 645, A130 [EDP Sciences] [Google Scholar]
- Cresci, G., Mannucci, F., Maiolino, R., et al. 2010, Nature, 467, 811 [Google Scholar]
- Cresci, G., Mannucci, F., Sommariva, V., et al. 2012, MNRAS, 421, 262 [NASA ADS] [Google Scholar]
- Curti, M., Cresci, G., Mannucci, F., et al. 2017, MNRAS, 465, 1384 [Google Scholar]
- Davies, R. L., Rich, J. A., Kewley, L. J., & Dopita, M. A. 2014, MNRAS, 439, 3835 [Google Scholar]
- de Vaucouleurs, G., de Vaucouleurs, A., & Corwin, Jr., H. G. 1976, Second Reference Catalogue of Bright Galaxies. Containing Information on 4364 Galaxies with References to Papers Published Between 1964 and 1975 [Google Scholar]
- de Vaucouleurs, G., de Vaucouleurs, A., Corwin, Jr., H. G., et al. 1991, Third Reference Catalogue of Bright Galaxies [Google Scholar]
- do Nascimento, J. C., Dors, O. L., Storchi-Bergmann, T., et al. 2022, MNRAS, 513, 807 [CrossRef] [Google Scholar]
- D’Odorico, V., Cristiani, S., Romano, D., Granato, G. L., & Danese, L. 2004, MNRAS, 351, 976 [CrossRef] [Google Scholar]
- Dopita, M. A., Pereira, M., Kewley, L. J., & Capaccioli, M. 2002, ApJS, 143, 47 [NASA ADS] [CrossRef] [Google Scholar]
- Dopita, M. A., Scharwächter, J., Shastri, P., et al. 2014, A&A, 566, A41 [NASA ADS] [CrossRef] [EDP Sciences] [Google Scholar]
- Dors, O. L., Freitas-Lemes, P., Amôres, E. B., et al. 2019, MNRAS, 492, 468 [Google Scholar]
- Edmunds, M. G., & Pagel, B. E. J. 1984, MNRAS, 211, 507 [NASA ADS] [CrossRef] [Google Scholar]
- Falcón-Barroso, J., Bacon, R., Bureau, M., et al. 2006, MNRAS, 369, 529 [Google Scholar]
- Franchetto, A., Vulcani, B., Poggianti, B. M., et al. 2020, ApJ, 895, 106 [NASA ADS] [CrossRef] [Google Scholar]
- Gallagher, R., Maiolino, R., Belfiore, F., et al. 2019, MNRAS, 485, 3409 [NASA ADS] [CrossRef] [Google Scholar]
- Groves, B. A., Heckman, T. M., & Kauffmann, G. 2006, MNRAS, 371, 1559 [NASA ADS] [CrossRef] [Google Scholar]
- Hillebrandt, W., & Niemeyer, J. C. 2000, ARA&A, 38, 191 [Google Scholar]
- Kang, D., & Woo, J.-H. 2018, ApJ, 864, 124 [NASA ADS] [CrossRef] [Google Scholar]
- Kauffmann, G., Heckman, T. M., White, S. D. M., et al. 2003, MNRAS, 341, 33 [Google Scholar]
- Kennicutt, R. C., Jr, Armus, L., Bendo, G., et al. 2003, PASP, 115, 928 [NASA ADS] [CrossRef] [Google Scholar]
- Kewley, L. J., & Ellison, S. L. 2008, ApJ, 681, 1183 [Google Scholar]
- Kewley, L. J., Dopita, M. A., Sutherland, R. S., Heisler, C. A., & Trevena, J. 2001, ApJ, 556, 121 [Google Scholar]
- Kirkpatrick, C. C., & McNamara, B. R. 2015, MNRAS, 452, 4361 [Google Scholar]
- Kirkpatrick, C. C., McNamara, B. R., & Cavagnolo, K. W. 2011, ApJ, 731, L23 [NASA ADS] [CrossRef] [Google Scholar]
- Knapen, J. H., Comerón, S., & Seidel, M. K. 2019, A&A, 621, L5 [NASA ADS] [CrossRef] [EDP Sciences] [Google Scholar]
- Lara-López, M. A., Cepa, J., Bongiovanni, A., et al. 2010, A&A, 521, L53 [CrossRef] [EDP Sciences] [Google Scholar]
- López-Sánchez, Á. R., Dopita, M. A., Kewley, L. J., et al. 2012, MNRAS, 426, 2630 [CrossRef] [Google Scholar]
- Maiolino, R., & Mannucci, F. 2019, A&ARv, 27, 3 [Google Scholar]
- Maiolino, R., Russell, H. R., Fabian, A. C., et al. 2017, Nature, 544, 202 [Google Scholar]
- Malkan, M. A., Gorjian, V., & Tam, R. 1998, ApJS, 117, 25 [Google Scholar]
- Mannucci, F., Cresci, G., Maiolino, R., Marconi, A., & Gnerucci, A. 2010, MNRAS, 408, 2115 [NASA ADS] [CrossRef] [Google Scholar]
- Marín, V. M. M., Storchi-Bergmann, T., Delgado, R. M. G., Schmitt, H. R., & Spinelli, P. 2010, Astrophys. Space Sci. Proc., 14, 321 [CrossRef] [Google Scholar]
- Matteucci, F., & Francois, P. 1989, MNRAS, 239, 885 [Google Scholar]
- McNamara, B. R., & Nulsen, P. E. J. 2012, New J. Phys., 14, 055023 [NASA ADS] [CrossRef] [Google Scholar]
- Meena, B., Crenshaw, D. M., Schmitt, H. R., et al. 2023, ApJ, 943, 98 [NASA ADS] [CrossRef] [Google Scholar]
- Mingozzi, M., Belfiore, F., Cresci, G., et al. 2020, A&A, 636, A42 [NASA ADS] [CrossRef] [EDP Sciences] [Google Scholar]
- Mishra, S., & Muzahid, S. 2022, ApJ, 933, 229 [NASA ADS] [CrossRef] [Google Scholar]
- Mollá, M., & Díaz, A. I. 2005, MNRAS, 358, 521 [CrossRef] [Google Scholar]
- Moustakas, J., Zaritsky, D., Brown, M., et al. 2011, ApJ, submitted [arXiv:1112.3300] [Google Scholar]
- Mulchaey, J. S., Regan, M. W., & Kundu, A. 1997, ApJS, 110, 299 [NASA ADS] [CrossRef] [Google Scholar]
- Nayakshin, S., & Sunyaev, R. 2005, MNRAS, 364, L23 [CrossRef] [Google Scholar]
- O’Sullivan, E., Giacintucci, S., David, L. P., et al. 2011, ApJ, 735, 11 [Google Scholar]
- Peña-Guerrero, M. A., Peimbert, A., & Peimbert, M. 2012, ApJ, 756, L14 [CrossRef] [Google Scholar]
- Phillips, M. M., Charles, P. A., & Baldwin, J. A. 1983, ApJ, 266, 485 [Google Scholar]
- Pogge, R. W. 1988, ApJ, 328, 519 [NASA ADS] [CrossRef] [Google Scholar]
- Pope, E. C. D., Babul, A., Pavlovski, G., Bower, R. G., & Dotter, A. 2010, MNRAS, 406, 2023 [NASA ADS] [Google Scholar]
- Pérez-Montero, E., & Contini, T. 2009, MNRAS, 398, 949 [CrossRef] [Google Scholar]
- Queyrel, J., Contini, T., Kissler-Patig, M., et al. 2012, A&A, 539, A93 [NASA ADS] [CrossRef] [EDP Sciences] [Google Scholar]
- Rosa, D. A., Rodrigues, I., Krabbe, A. C., Milone, A. C., & Carvalho, S. 2021, MNRAS, 501, 3750 [NASA ADS] [CrossRef] [Google Scholar]
- Sánchez, S. F., Kennicutt, R. C., Gil de Paz, A., et al. 2012, A&A, 538, A8 [Google Scholar]
- Sánchez Almeida, J., Morales-Luis, A. B., Muñoz-Tuñón, C., et al. 2014, ApJ, 783, 45 [Google Scholar]
- Sanders, R. L., Shapley, A. E., Kriek, M., et al. 2016, ApJ, 816, 23 [Google Scholar]
- Sarzi, M., Falcón-Barroso, J., Davies, R. L., et al. 2006, MNRAS, 366, 1151 [Google Scholar]
- Simionescu, A., Werner, N., Finoguenov, A., Böhringer, H., & Brüggen, M. 2008, A&A, 482, 97 [NASA ADS] [CrossRef] [EDP Sciences] [Google Scholar]
- Simionescu, A., Roediger, E., Nulsen, P. E. J., et al. 2009, A&A, 495, 721 [NASA ADS] [CrossRef] [EDP Sciences] [Google Scholar]
- Simons, R. C., Papovich, C., Momcheva, I., et al. 2021, ApJ, 923, 203 [NASA ADS] [CrossRef] [Google Scholar]
- Skrutskie, M. F., Cutri, R. M., Stiening, R., et al. 2006, AJ, 131, 1163 [NASA ADS] [CrossRef] [Google Scholar]
- Somerville, R. S., & Davé, R. 2015, ARA&A, 53, 51 [Google Scholar]
- Sommariva, V., Mannucci, F., Cresci, G., et al. 2012, A&A, 539, A136 [NASA ADS] [CrossRef] [EDP Sciences] [Google Scholar]
- Storchi-Bergmann, T., Schmitt, H. R., Calzetti, D., & Kinney, A. L. 1998, AJ, 115, 909 [NASA ADS] [CrossRef] [Google Scholar]
- Storchi-Bergmann, T., & Schnorr-Müller, A. 2019, Nat. Astron., 3, 48 [Google Scholar]
- Thielemann, F.-K., Eichler, M., Panov, I., & Wehmeyer, B. 2017, Ann. Rev. Nucl. Part. Sci., 67, 253 [NASA ADS] [CrossRef] [Google Scholar]
- Thomas, A. D., Kewley, L. J., Dopita, M. A., et al. 2019, ApJ, 874, 100 [NASA ADS] [CrossRef] [Google Scholar]
- Unger, S. W., Pedlar, A., Axon, D. J., et al. 1987, MNRAS, 228, 671 [NASA ADS] [CrossRef] [Google Scholar]
- van Winckel, H. 2003, ARA&A, 41, 391 [Google Scholar]
- Vaona, L., Ciroi, S., Di Mille, F., et al. 2012, MNRAS, 427, 1266 [NASA ADS] [CrossRef] [Google Scholar]
- Veilleux, S., & Osterbrock, D. E. 1987, ApJS, 63, 295 [Google Scholar]
- Wang, X., Jones, T. A., Treu, T., et al. 2019, ApJ, 882, 94 [Google Scholar]
- Woosley, S. E., Heger, A., & Weaver, T. A. 2002, Rev. Mod. Phys., 74, 1015 [NASA ADS] [CrossRef] [Google Scholar]
- Zhang, X. 2022, ApJS, 260, 31 [NASA ADS] [CrossRef] [Google Scholar]
- Zhao, Y., Lu, N., Xu, C. K., et al. 2016, ApJ, 820, 118 [Google Scholar]
All Tables
All Figures
|
Fig. 1. BPT diagnostic diagram to discriminate between SF- and AGN-ionised regions. The dashed black line and the solid red line show the separations between the two populations according to the boundaries from Kewley et al. (2001) and Kauffmann et al. (2003), respectively. Circles and blue stars mark AGN- and SF-dominated regions, respectively. Plots are colour-coded according to how far bins are from the centre. We have not investigated the regions located between the two lines (purple circles). |
| In the text | |
|
Fig. 2. Distribution of Zgas for the four components described Sect. 2. The vertical dashed lines show the median value of Zgas for each of the components. |
| In the text | |
|
Fig. 3. Hubble Space Telescope F555W image of the central region of NGC 7130 superimposed on the MUSE-Narrow Field Mode(NFM) coverage area and the MUSE data cube integrated along the spectral direction (lower-left panel). The top-left panel illustrates the ionised circumnuclear gas in NGC 7130 using the toy model from Comerón et al. (2021). The right panel displays the spatial (X, Y) distribution of bins for four of the nine components in NGC 7130. The circles mark the AGNs determined based on the BPT classification, and stars mark SF regions. The coordinates are given in arcseconds in each panel, and the colour bar is for the Zgas. |
| In the text | |
|
Fig. 4. Metallicity gradient profiles for each component using the Storchi-Bergmann et al. (1998) and Curti et al. (2017) metallicity relations for AGNs (red circles) and SF regions (blue stars), respectively, with the radius (in kpc) given on the bottom axis. Overplotted are binned linear fits to the radial metallicity gradient in AGNs (dotted red lines) and SF regions (dotted blue lines). The bigger dots mark the binned median values, and error bars represent the scatter in the data within each bin. |
| In the text | |
Current usage metrics show cumulative count of Article Views (full-text article views including HTML views, PDF and ePub downloads, according to the available data) and Abstracts Views on Vision4Press platform.
Data correspond to usage on the plateform after 2015. The current usage metrics is available 48-96 hours after online publication and is updated daily on week days.
Initial download of the metrics may take a while.