Fig. 1.
Download original image
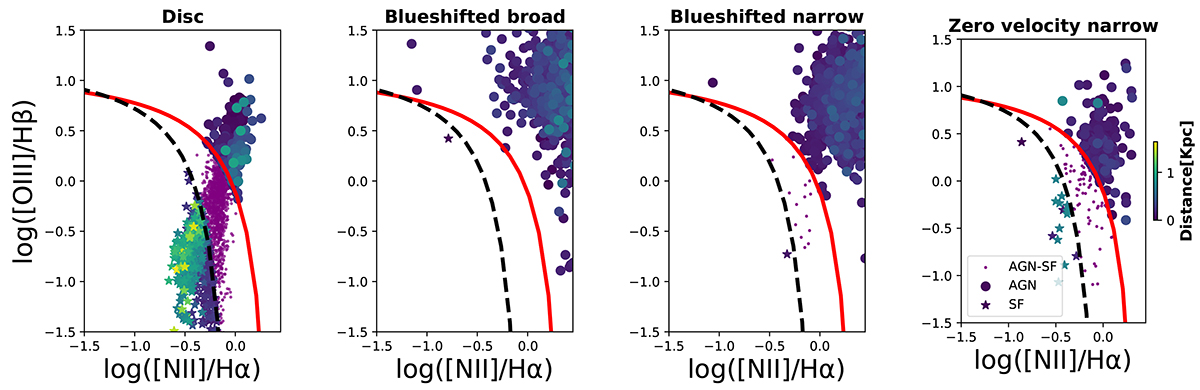
BPT diagnostic diagram to discriminate between SF- and AGN-ionised regions. The dashed black line and the solid red line show the separations between the two populations according to the boundaries from Kewley et al. (2001) and Kauffmann et al. (2003), respectively. Circles and blue stars mark AGN- and SF-dominated regions, respectively. Plots are colour-coded according to how far bins are from the centre. We have not investigated the regions located between the two lines (purple circles).
Current usage metrics show cumulative count of Article Views (full-text article views including HTML views, PDF and ePub downloads, according to the available data) and Abstracts Views on Vision4Press platform.
Data correspond to usage on the plateform after 2015. The current usage metrics is available 48-96 hours after online publication and is updated daily on week days.
Initial download of the metrics may take a while.