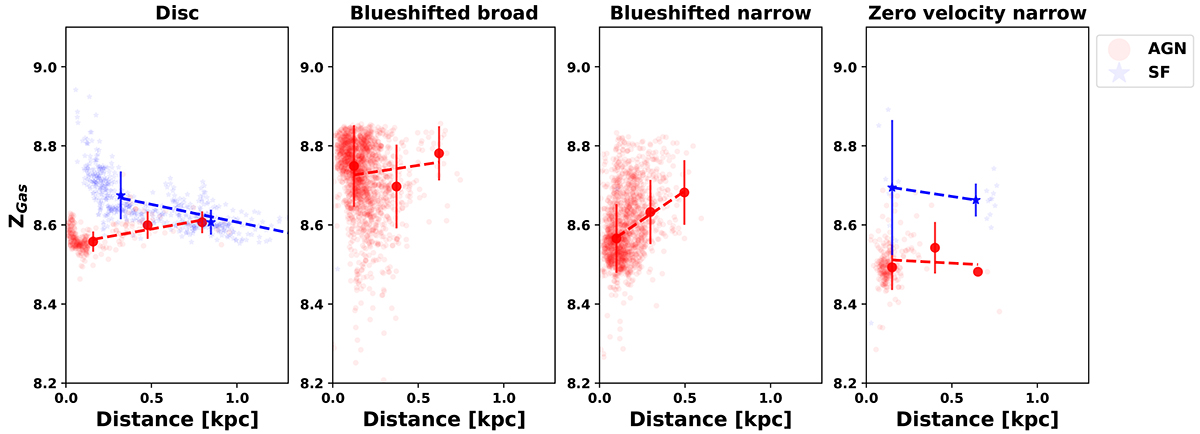
Fig. 4.
Download original image
Metallicity gradient profiles for each component using the Storchi-Bergmann et al. (1998) and Curti et al. (2017) metallicity relations for AGNs (red circles) and SF regions (blue stars), respectively, with the radius (in kpc) given on the bottom axis. Overplotted are binned linear fits to the radial metallicity gradient in AGNs (dotted red lines) and SF regions (dotted blue lines). The bigger dots mark the binned median values, and error bars represent the scatter in the data within each bin.
Current usage metrics show cumulative count of Article Views (full-text article views including HTML views, PDF and ePub downloads, according to the available data) and Abstracts Views on Vision4Press platform.
Data correspond to usage on the plateform after 2015. The current usage metrics is available 48-96 hours after online publication and is updated daily on week days.
Initial download of the metrics may take a while.