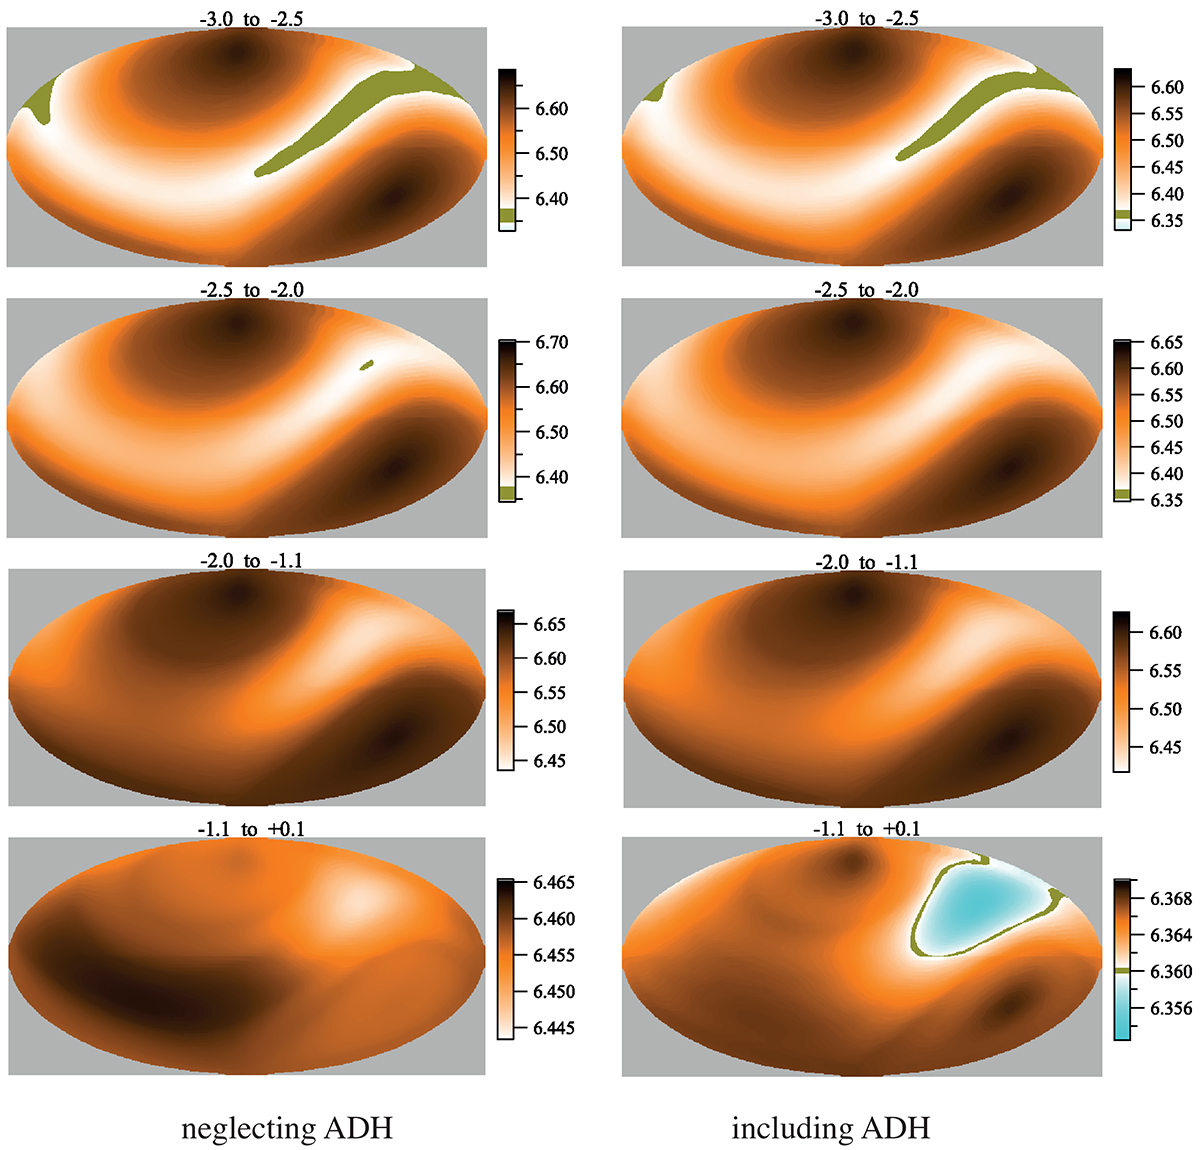
Fig. 9.
Download original image
Comparison of all atmosphere of stationary solutions for 3D calcium abundances (tomographic view) without (left panels) and with ADH (right panels) in four contiguous slabs of a magnetic atmosphere, situated between log τ = −3.0 and +0.1 (Hammer equal-area projection). The depth interval of each slab is written at the top of each panel. The dark green colour corresponds to the solar abundance (6.36 ± 10%). The mass-loss rate is assumed to be uniform over the star (3.8 10−13 solar mass per year, or Z-loss = 8.36 10−15). In the last panel on the right, displaying abundances with ADH, Ca is slightly under-abundant (light blue) in some parts of the star at a depth of around log τ = 0.0, as in Fig. 6. In this slab, the Ca abundance differs very little from the solar value.
Current usage metrics show cumulative count of Article Views (full-text article views including HTML views, PDF and ePub downloads, according to the available data) and Abstracts Views on Vision4Press platform.
Data correspond to usage on the plateform after 2015. The current usage metrics is available 48-96 hours after online publication and is updated daily on week days.
Initial download of the metrics may take a while.