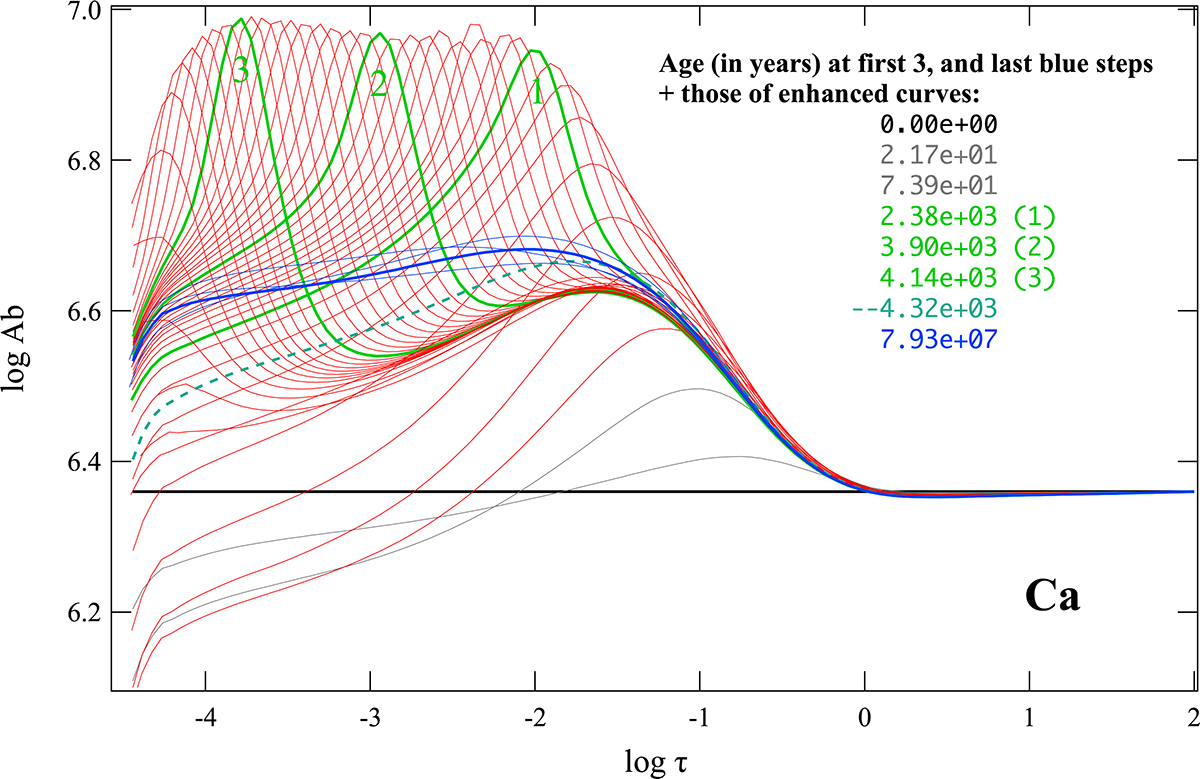
Fig. 5.
Download original image
Evolution of the Ca abundance stratification in our Teff = 8500 K, log g = 4.0 atmospheric model, assuming a mass-loss rate of 3.8 10−13 solar mass per year (Z-loss = 8.36 10−15). The horizontal thick solid black line shows the abundance at t = 0 (homogeneous solar abundance), and the thick solid blue curve represents the final stationary solution (t = 7.93 107 years). This is the same stratification as shown by the solid line in Fig. 4. The stratification at intermediate time steps is displayed with thin lines (grey, red, and blue), and a few of them are highlighted (thick green curves); the corresponding ages in years are listed within the drawing area (same colours as the corresponding curves). Three of the four green curves are tagged (1–3) to illustrate the development and subsequent expulsion of a Ca cloud. The dashed thick green line corresponds to the three stratification steps prior to stationarity (towards the end, the evolution slows down markedly).
Current usage metrics show cumulative count of Article Views (full-text article views including HTML views, PDF and ePub downloads, according to the available data) and Abstracts Views on Vision4Press platform.
Data correspond to usage on the plateform after 2015. The current usage metrics is available 48-96 hours after online publication and is updated daily on week days.
Initial download of the metrics may take a while.