Open Access
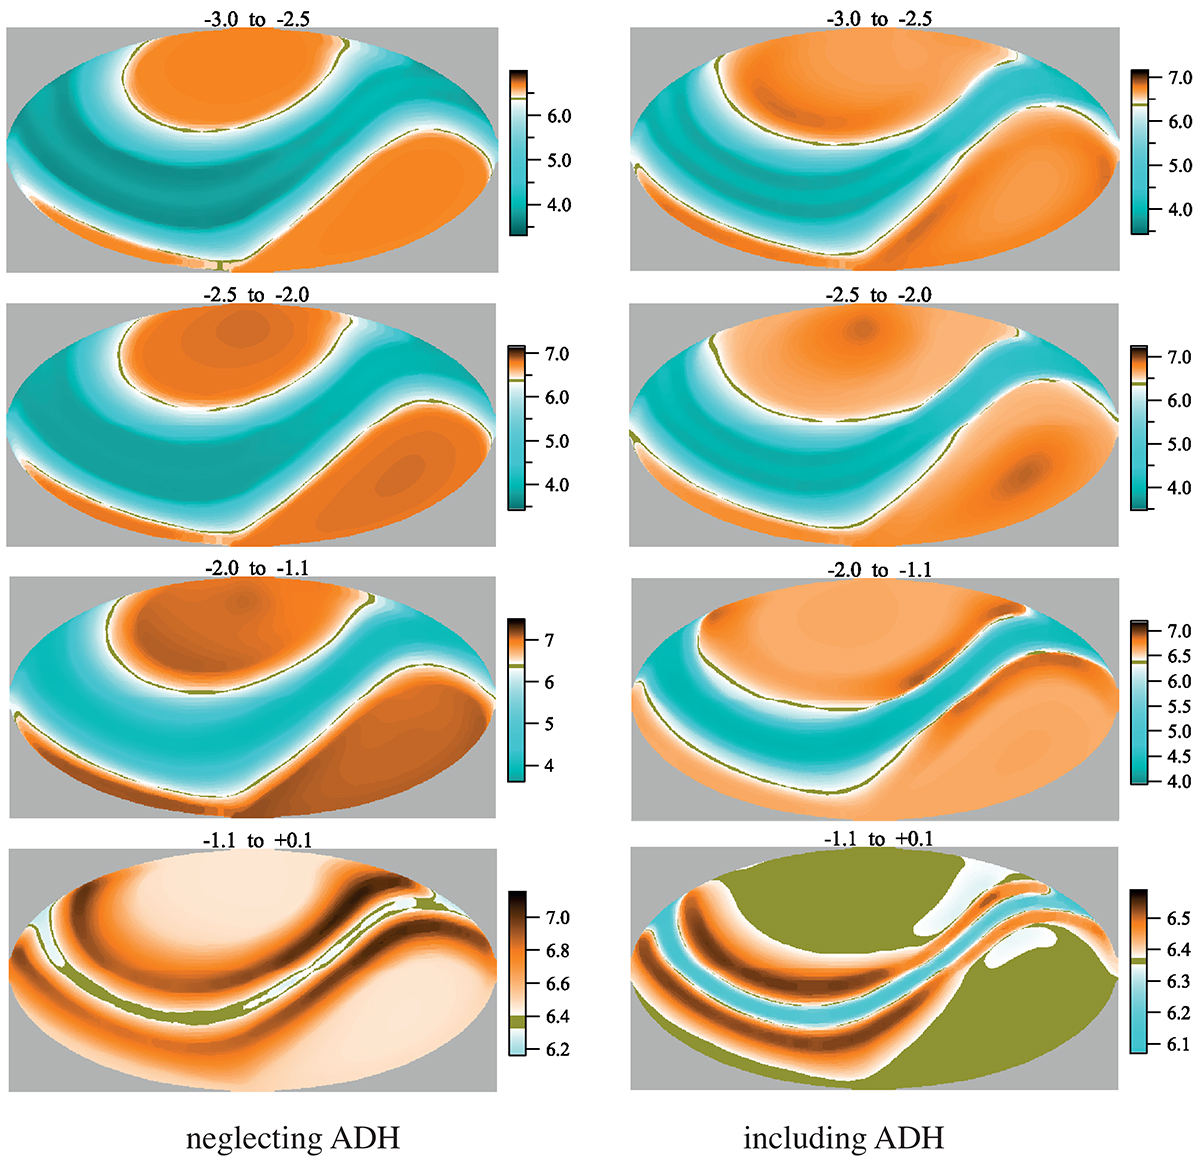
Fig. 11.
Download original image
Same as Fig. 9, but assuming the non-uniform mass-loss rates shown in Fig. 10. The abundances of Ca are no longer stationary solutions, but are those reached after 1000 years of diffusion. The similarities between the images can be misleading when the colour scale next to each panel is not taken into account.
Current usage metrics show cumulative count of Article Views (full-text article views including HTML views, PDF and ePub downloads, according to the available data) and Abstracts Views on Vision4Press platform.
Data correspond to usage on the plateform after 2015. The current usage metrics is available 48-96 hours after online publication and is updated daily on week days.
Initial download of the metrics may take a while.