Fig. 1.
Download original image
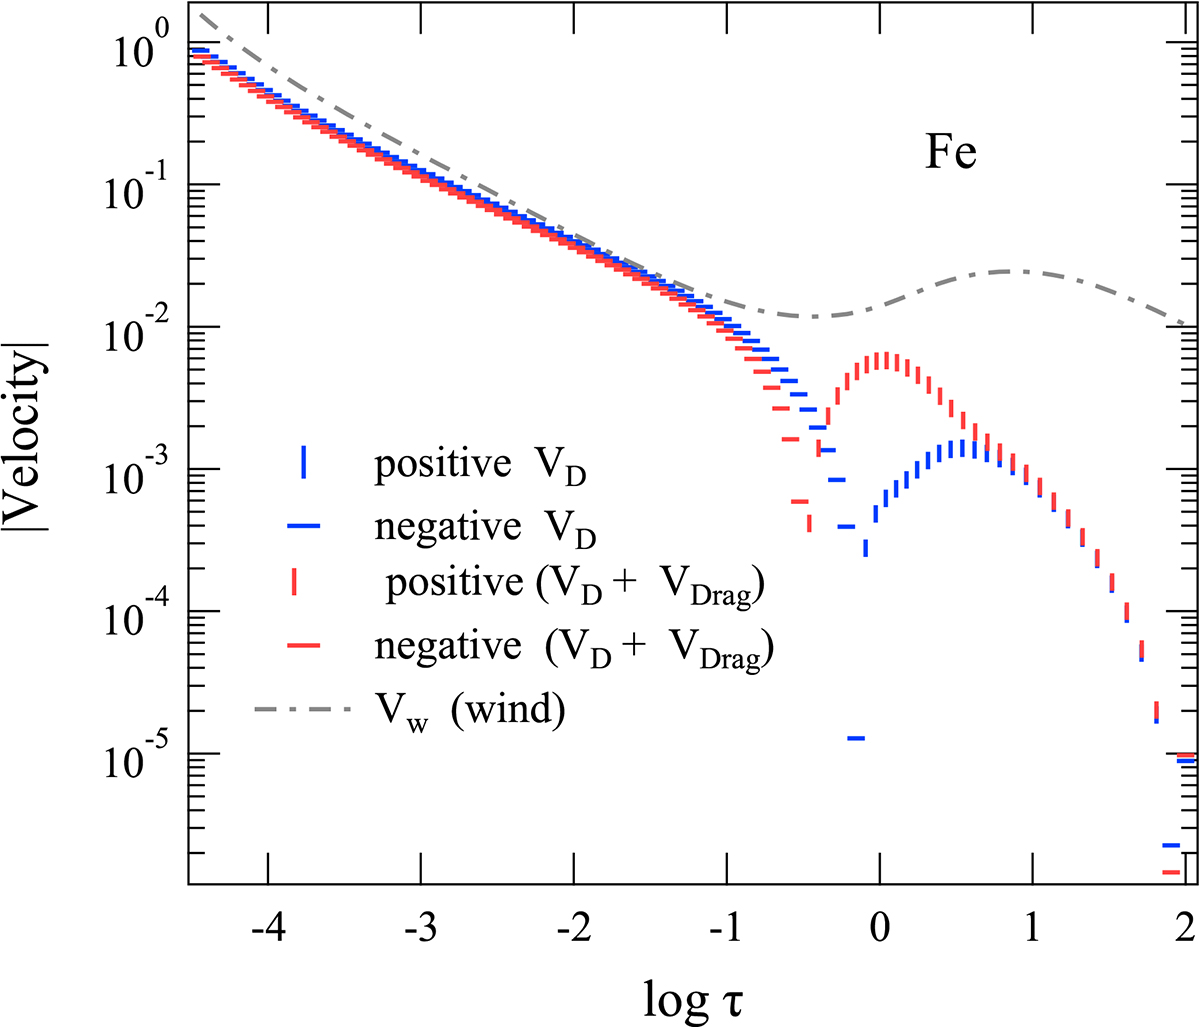
Velocities involved in Eqs. (1) and (2) for iron. The absolute velocity values in cm s−1 are plotted vs. the optical depth. The thick dash-pointed grey curve shows the wind velocity (VW, always positive). VD and VD + Vdrag for the stationary solutions are plotted in blue and red, respectively. Positive velocities have vertical bar markers, and negative velocities have horizontal bar markers.
Current usage metrics show cumulative count of Article Views (full-text article views including HTML views, PDF and ePub downloads, according to the available data) and Abstracts Views on Vision4Press platform.
Data correspond to usage on the plateform after 2015. The current usage metrics is available 48-96 hours after online publication and is updated daily on week days.
Initial download of the metrics may take a while.