Fig. 6
Download original image
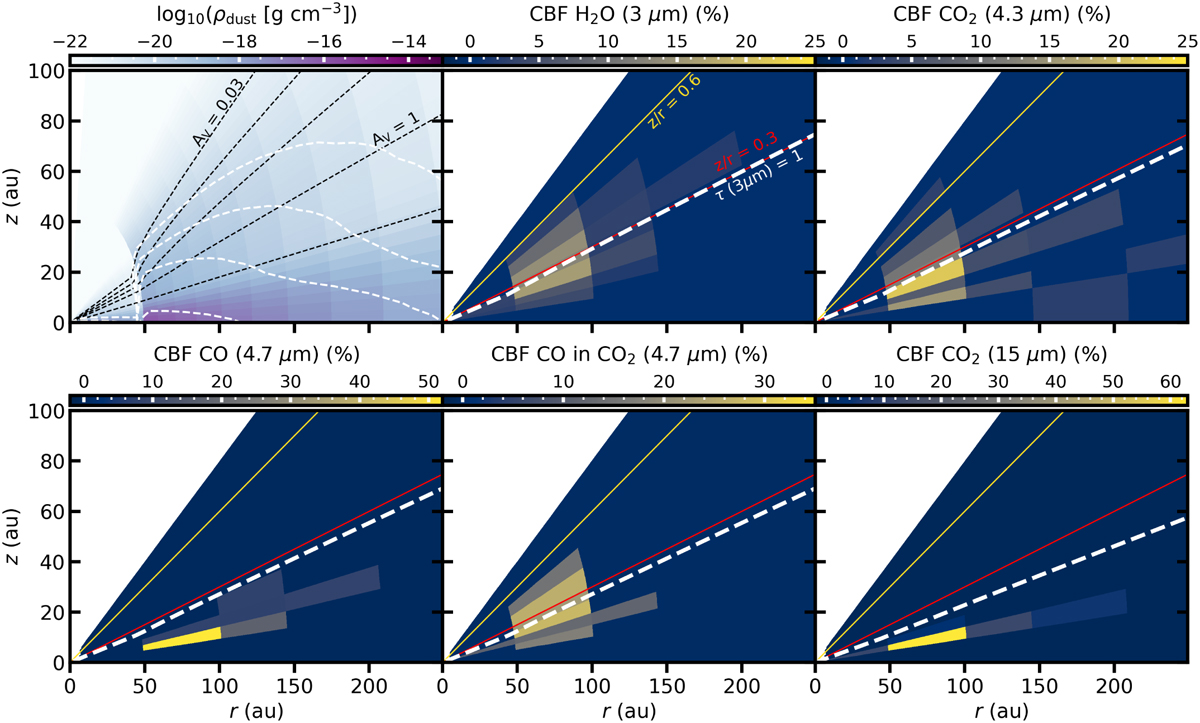
Contribution function of the ice absorption features. Top left: total dust density distribution in the model with internal shielding (radial AV; dashed black line) at 0.03, 0.1, 0.3, 1, and 10 mag and external shielding (vertical AV; white dashed line) at 0.01, 0.03, 0.1, and 1 mag from top to bottom. The other panels show the contribution function (CBF), i.e., the contribution of a specific region to the total absorption of the ice feature in percentages. The pure CO ice at high abundance is added for reference, but we argue in the main text that this component is not observed. The absorbing area is the region in the disk that contribute significantly to the total absorption. The red and yellow lines indicate the fiducial and best fit photodesorption snow surface, respectively, for reference. The thick, dashed white line shows the τ = 1 surface at the ice feature wavelength. We would like to note that viewing angle is really important and is 83° in this case
Current usage metrics show cumulative count of Article Views (full-text article views including HTML views, PDF and ePub downloads, according to the available data) and Abstracts Views on Vision4Press platform.
Data correspond to usage on the plateform after 2015. The current usage metrics is available 48-96 hours after online publication and is updated daily on week days.
Initial download of the metrics may take a while.