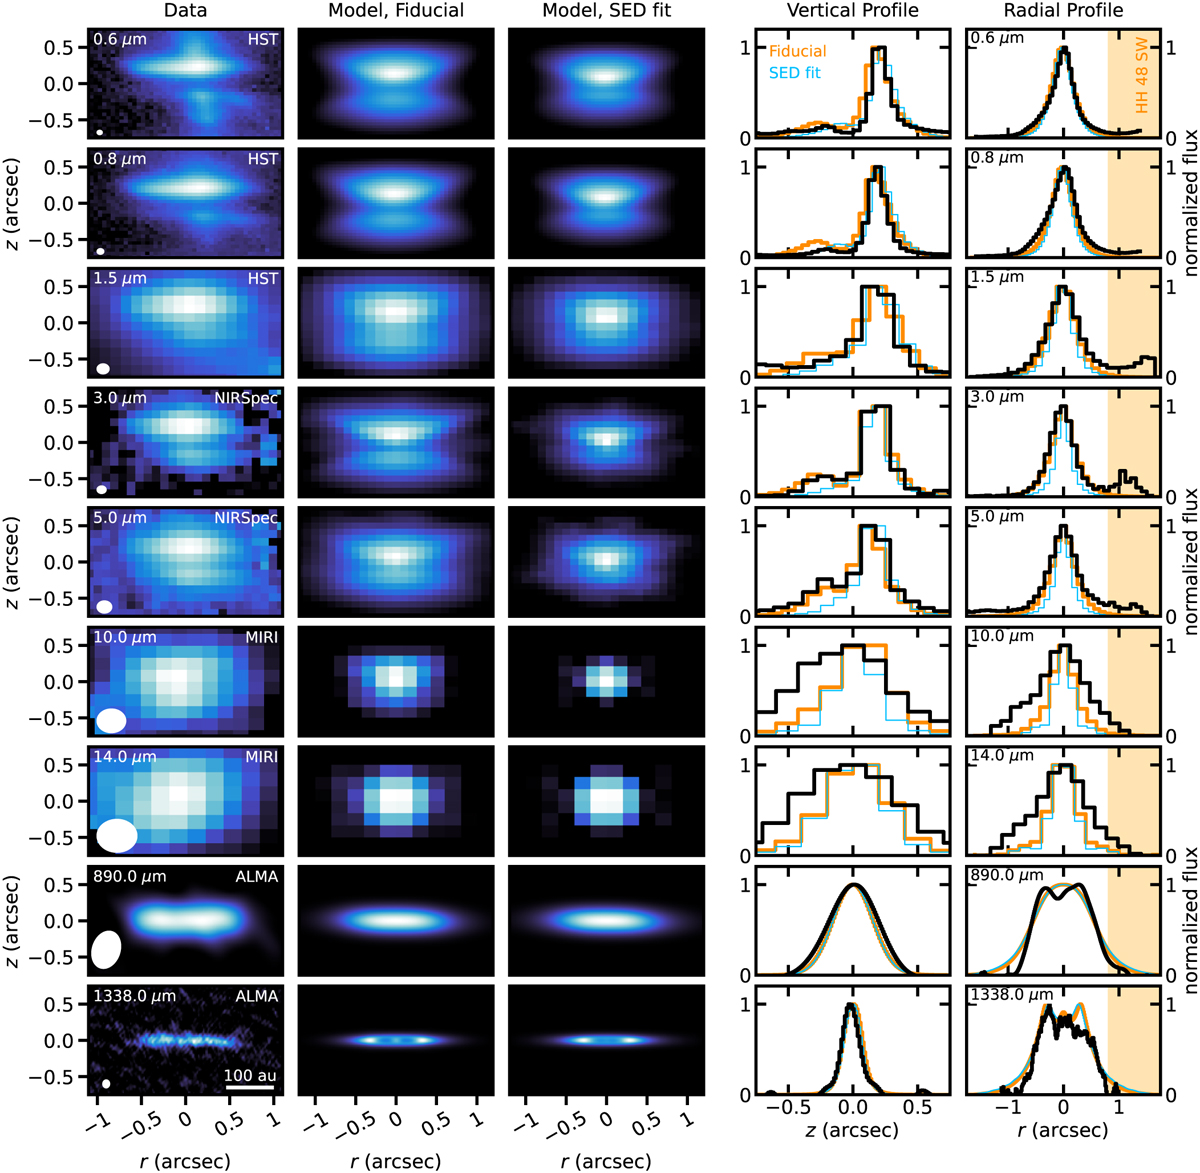
Fig. 4
Download original image
Multi-wavelength spatial comparison between the models and the observations. First column from the left: the spatial appearance of the continuum emission from HH 48 NE in the optical HST observations, JWST MIRI observations, and millimeter ALMA continuum observations. Second and third columns: spatial appearance of the continuum emission from the fiducial model and MIRI fit, respectively, after convolution to a representative PSF. Last two columns: median averaged vertical and radial profile of the continuum emission normalized to the peak (black) with the fiducial model (orange) and MIRI fit (blue) on top. The orange box marks the region where HH 48 SW starts dominating the continuum.
Current usage metrics show cumulative count of Article Views (full-text article views including HTML views, PDF and ePub downloads, according to the available data) and Abstracts Views on Vision4Press platform.
Data correspond to usage on the plateform after 2015. The current usage metrics is available 48-96 hours after online publication and is updated daily on week days.
Initial download of the metrics may take a while.