Fig. 2
Download original image
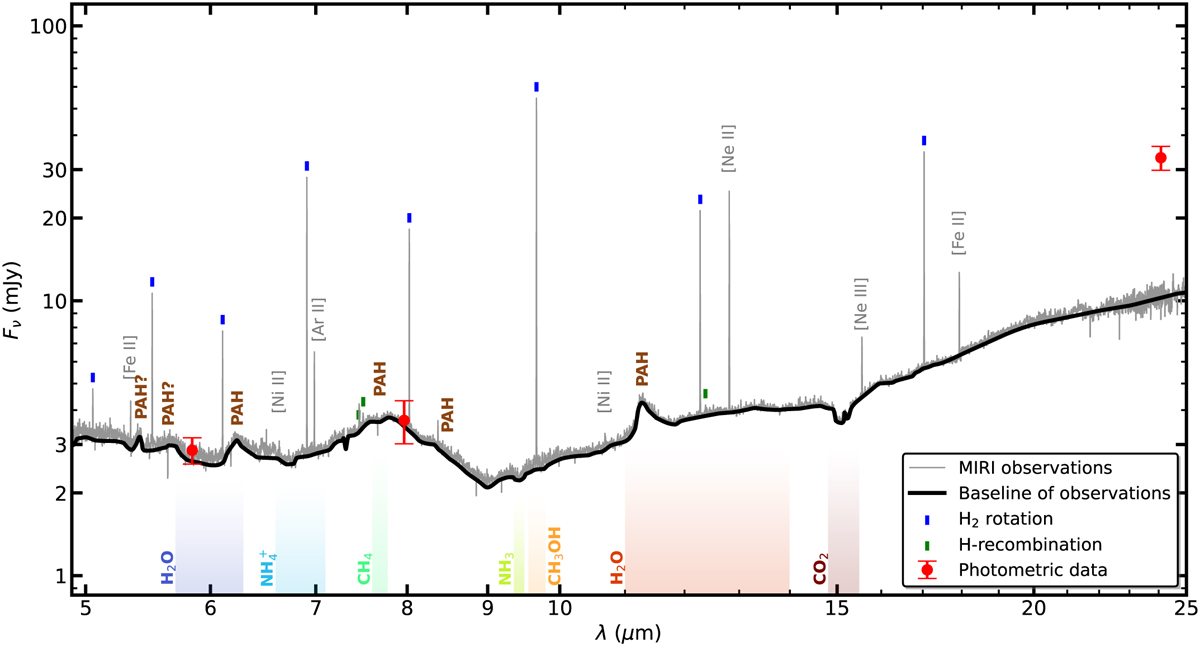
Integrated MIRI spectrum of HH 48 NE. The continuum baseline underneath the gas emission lines is shown as a black line. Gas features are labeled accordingly. Molecular and recombination hydrogen lines are marked with colored tick marks. Absorption wavelength regions for important ices are marked on the bottom. Spitzer photometric data points are shown in red.
Current usage metrics show cumulative count of Article Views (full-text article views including HTML views, PDF and ePub downloads, according to the available data) and Abstracts Views on Vision4Press platform.
Data correspond to usage on the plateform after 2015. The current usage metrics is available 48-96 hours after online publication and is updated daily on week days.
Initial download of the metrics may take a while.