Fig. A.1
Download original image
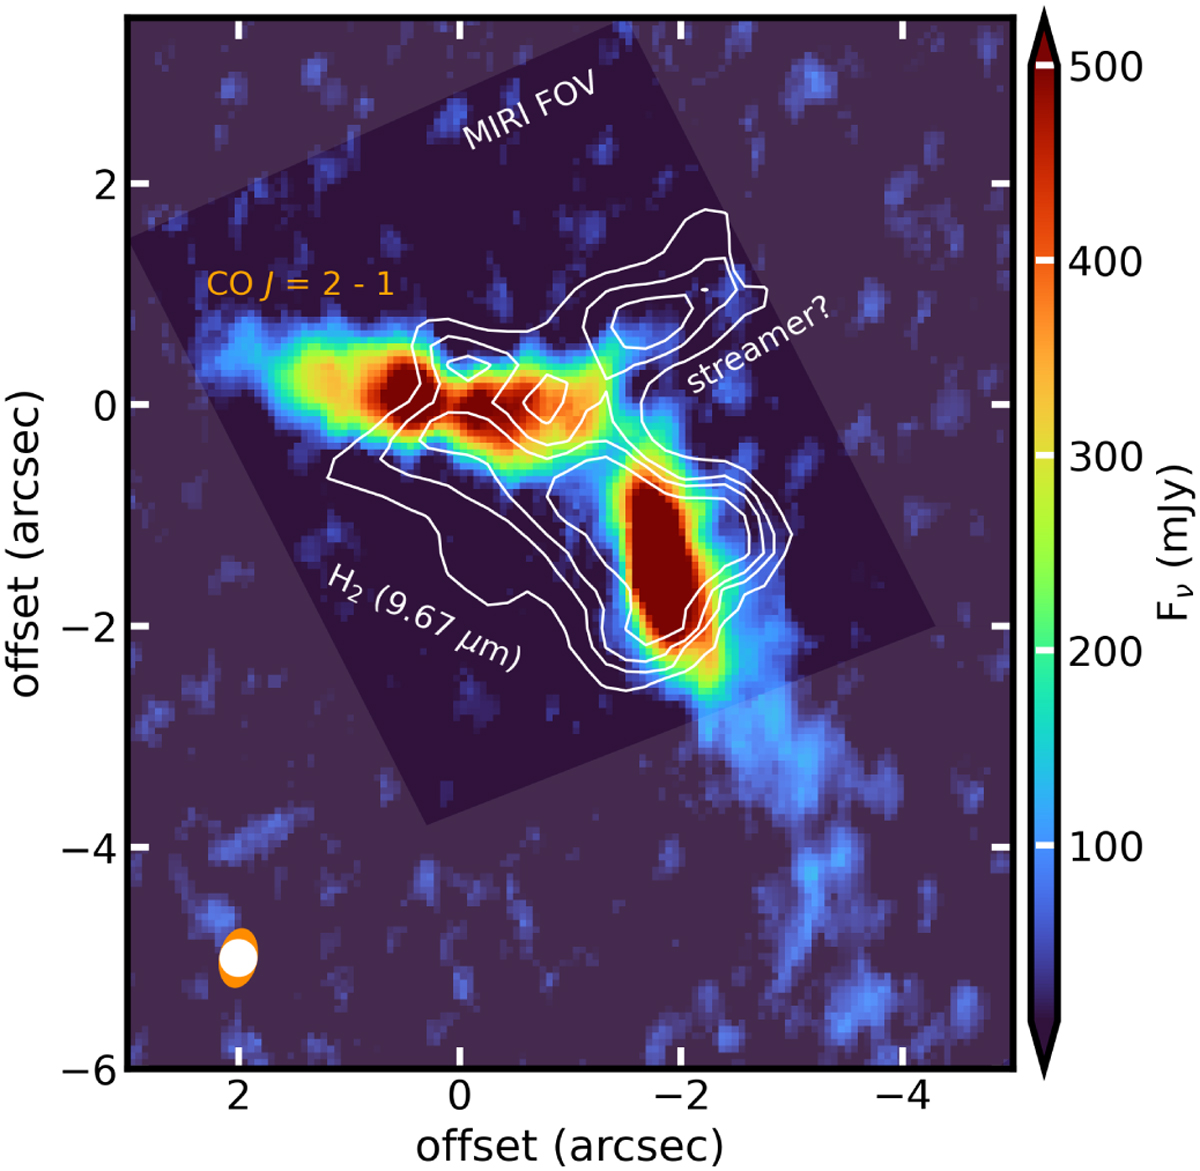
Overview of the asymmetric emission in the HH 48 system. The colored image shows the integrated CO J = 2 – −1 emission map of HH 48 NE (Sturm et al. 2023c). The contours indicate the spatial extent of the low energy H2 emission line at 9.67 μm. The ALMA beam (orange) and MIRI PSF size at 9.7 μm (white) are shown at the bottom right.
Current usage metrics show cumulative count of Article Views (full-text article views including HTML views, PDF and ePub downloads, according to the available data) and Abstracts Views on Vision4Press platform.
Data correspond to usage on the plateform after 2015. The current usage metrics is available 48-96 hours after online publication and is updated daily on week days.
Initial download of the metrics may take a while.