Open Access
Fig. 9.
Download original image
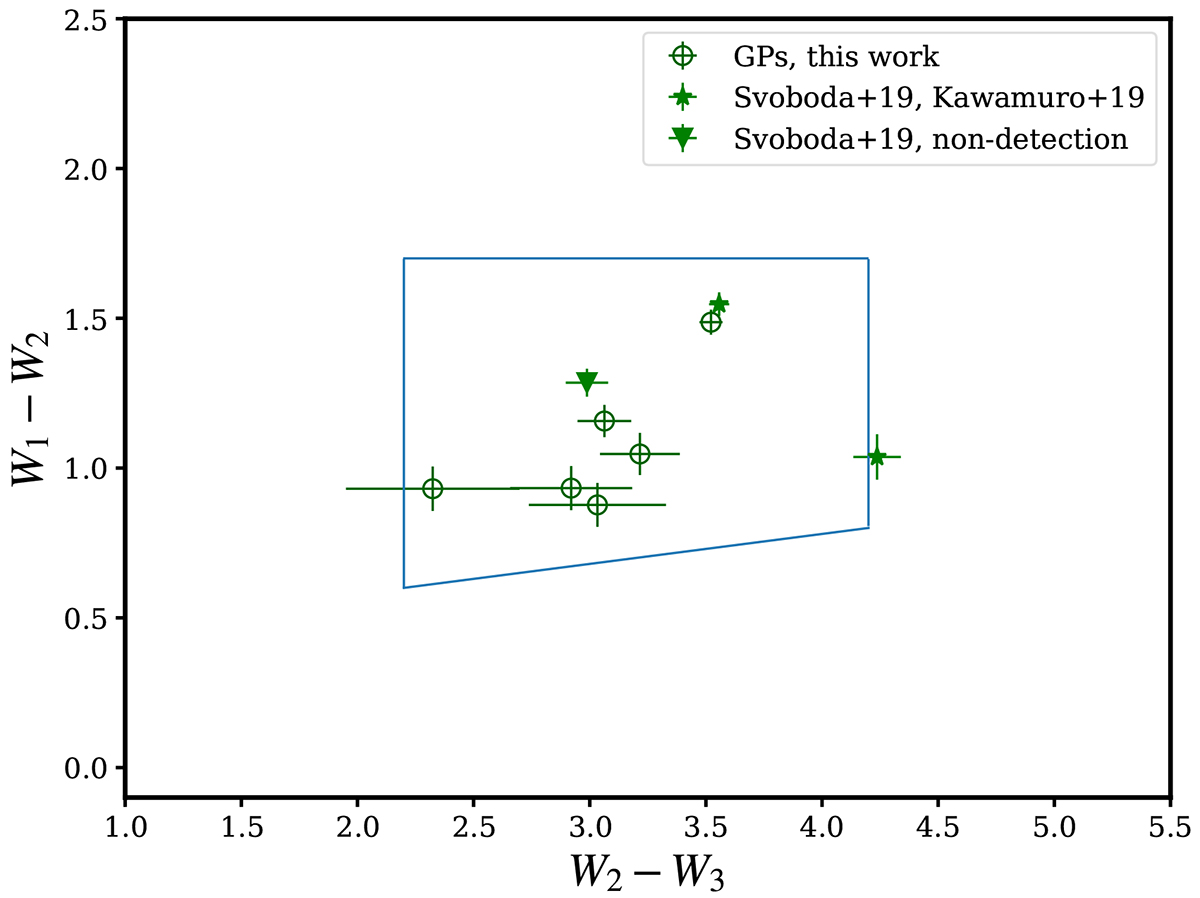
MIR color–color plot for the GPs. The solid lines mark the regions used by Jarrett et al. (2011) to select AGNs. The GPs studied in Svoboda et al. (2019) and Kawamuro et al. (2019) are also included for comparison.
Current usage metrics show cumulative count of Article Views (full-text article views including HTML views, PDF and ePub downloads, according to the available data) and Abstracts Views on Vision4Press platform.
Data correspond to usage on the plateform after 2015. The current usage metrics is available 48-96 hours after online publication and is updated daily on week days.
Initial download of the metrics may take a while.