Fig. 7.
Download original image
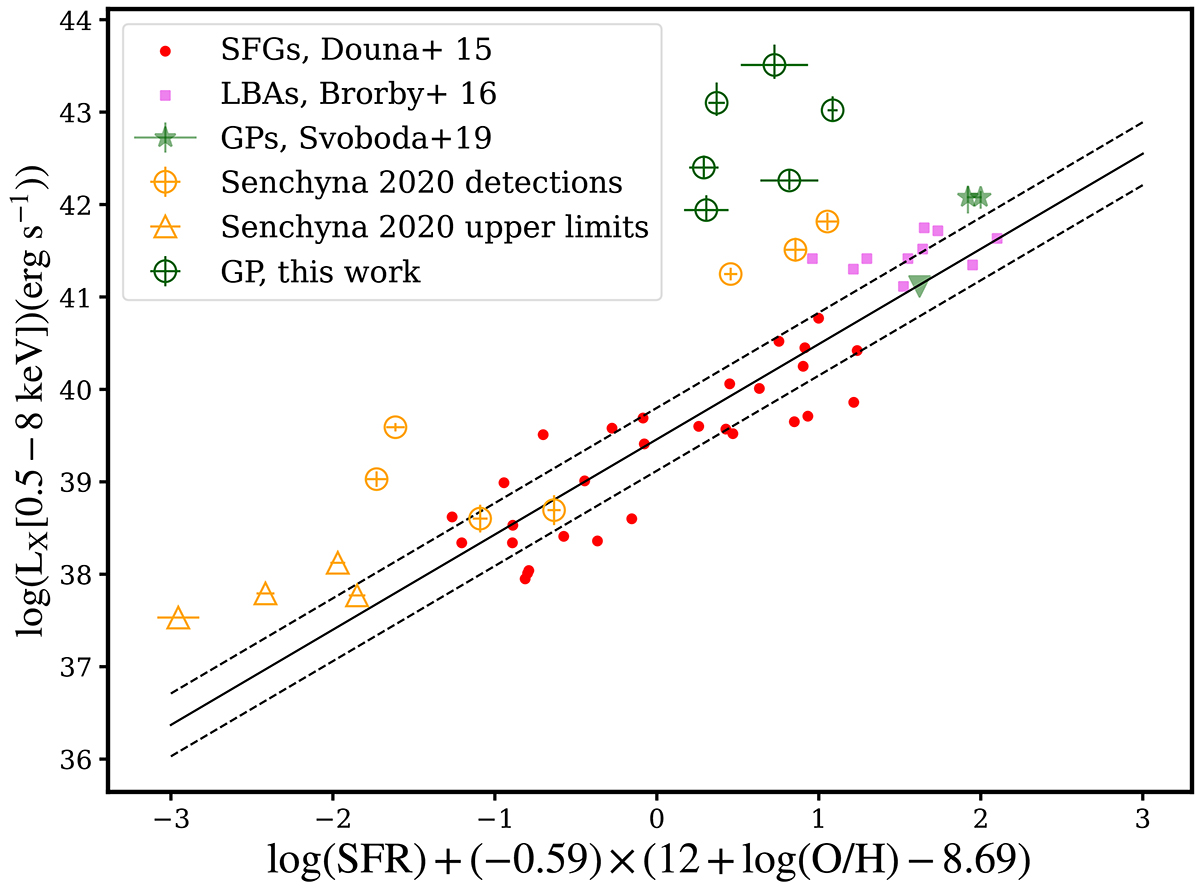
LX–SFR–metallicity relation of the GPs. Green open circles with error bars represent the GPs in this study. The solid line denotes the best-fit LX–SFR–metallicity relation from Brorby et al. (2016), with dashed lines indicating a dispersion of σ = 0.34 dex. Red circles represent SFGs from Douna et al. (2015), and magenta squares represent LBAs from Brorby et al. (2016). Orange open circles indicate seven detections from Chandra observations, while orange triangles denote the four upper limits for low-redshift SFGs (Senchyna et al. 2020).
Current usage metrics show cumulative count of Article Views (full-text article views including HTML views, PDF and ePub downloads, according to the available data) and Abstracts Views on Vision4Press platform.
Data correspond to usage on the plateform after 2015. The current usage metrics is available 48-96 hours after online publication and is updated daily on week days.
Initial download of the metrics may take a while.