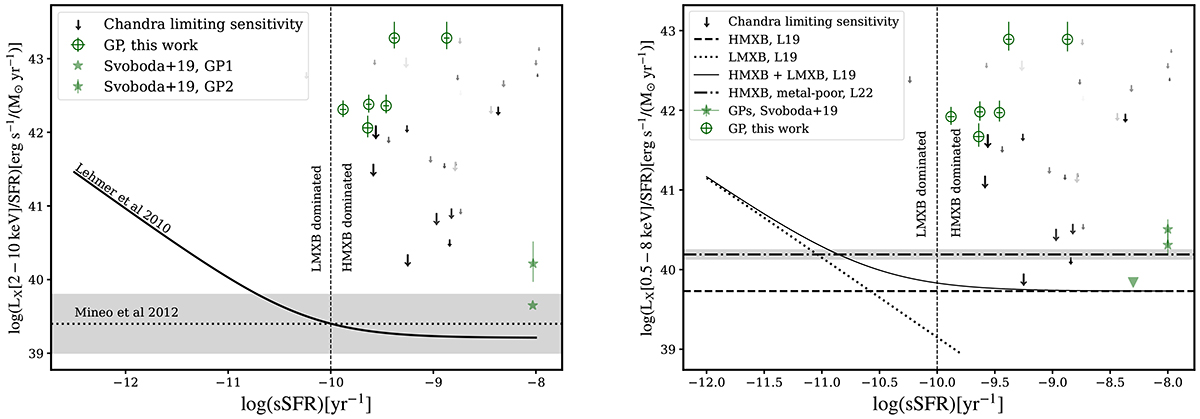
Fig. 6.
Download original image
Relations of the rest-frame X-ray luminosity in the 2–10 keV (left panel) and 0.5–8 keV energy bands (right panel) per SFR vs. sSFR. The green circles mark the GP measurements. Different LX–SFR relations in the form of Eq. (2) are marked in the left panel (Lehmer et al. 2010; Mineo et al. 2012b) and the right panel (Lehmer et al. 2019, 2022); the shaded regions mark the 1σ scatter. The gray downward pointing arrows indicate the upper limits of GPs with only limiting sensitivities from Chandra (see Sect. 4.1 for a discussion). The arrow size corresponds to the exposure time, with larger arrows indicating longer exposure times. The grayscale represents the source’s off-axis angle from the image center, with lighter shades indicating larger off-axis angles.
Current usage metrics show cumulative count of Article Views (full-text article views including HTML views, PDF and ePub downloads, according to the available data) and Abstracts Views on Vision4Press platform.
Data correspond to usage on the plateform after 2015. The current usage metrics is available 48-96 hours after online publication and is updated daily on week days.
Initial download of the metrics may take a while.