Fig. 2.
Download original image
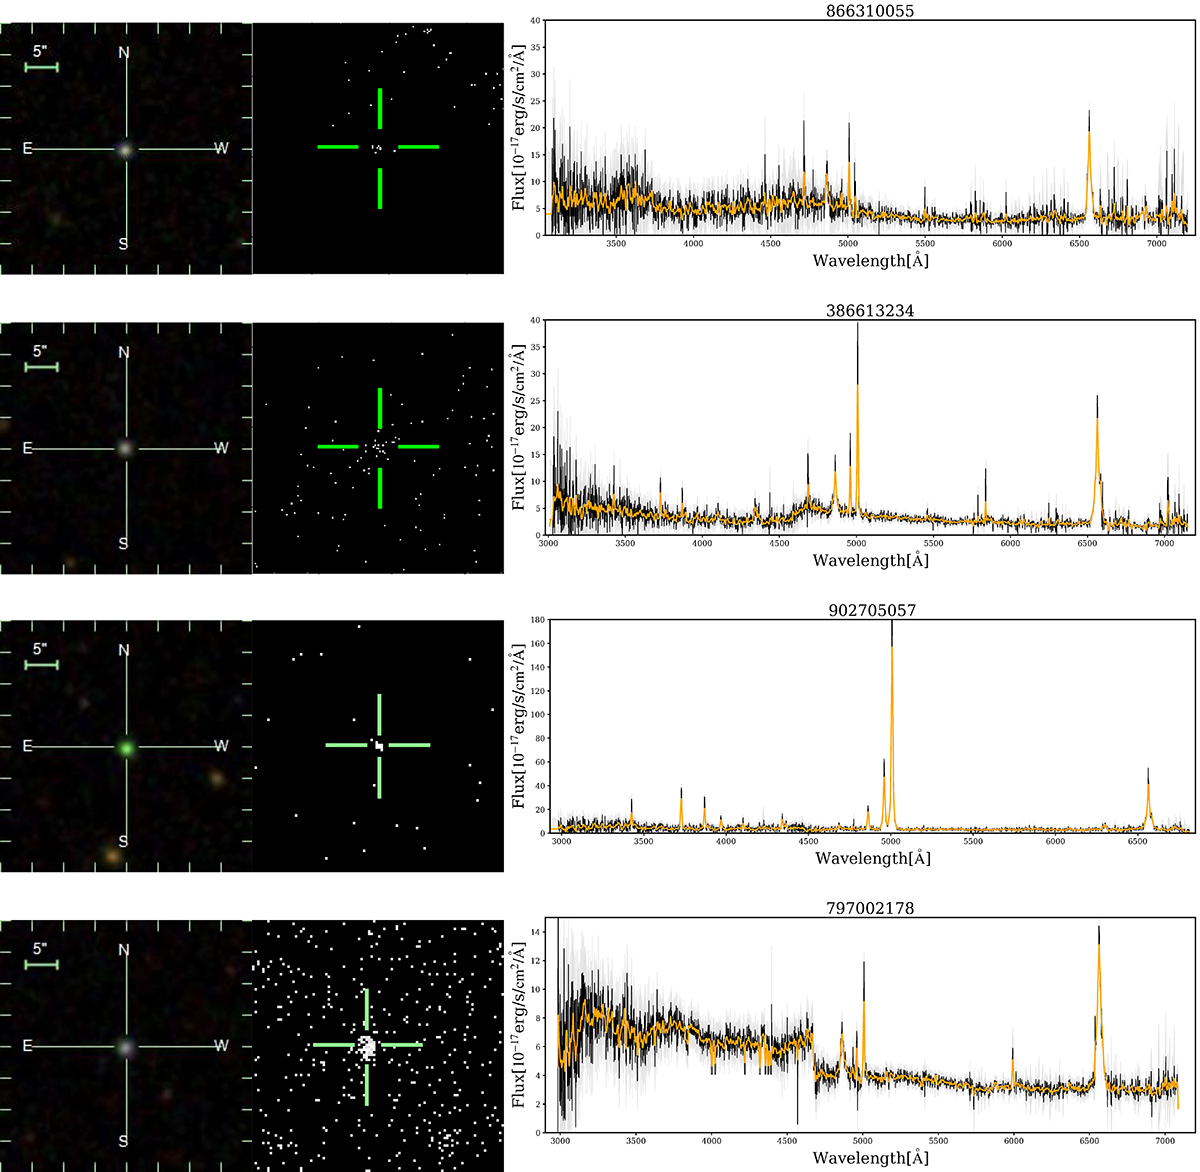
GPs with X-ray detection from Swift (J0205+1504 and J0227+2355; top two rows), the GP with X-ray detection from Chandra (J1605+4405; third row), and the GP with X-ray detection from eROSITA (J0906+0242; bottom row). Left panels: SDSS, Swift, and Chandra image cutouts. Right panels: LAMOST spectra. The black lines mark the flux-calibrated spectrum, the orange curves the spectrum smoothed with a kernel of 3, and the gray-shaded regions the flux error.
Current usage metrics show cumulative count of Article Views (full-text article views including HTML views, PDF and ePub downloads, according to the available data) and Abstracts Views on Vision4Press platform.
Data correspond to usage on the plateform after 2015. The current usage metrics is available 48-96 hours after online publication and is updated daily on week days.
Initial download of the metrics may take a while.