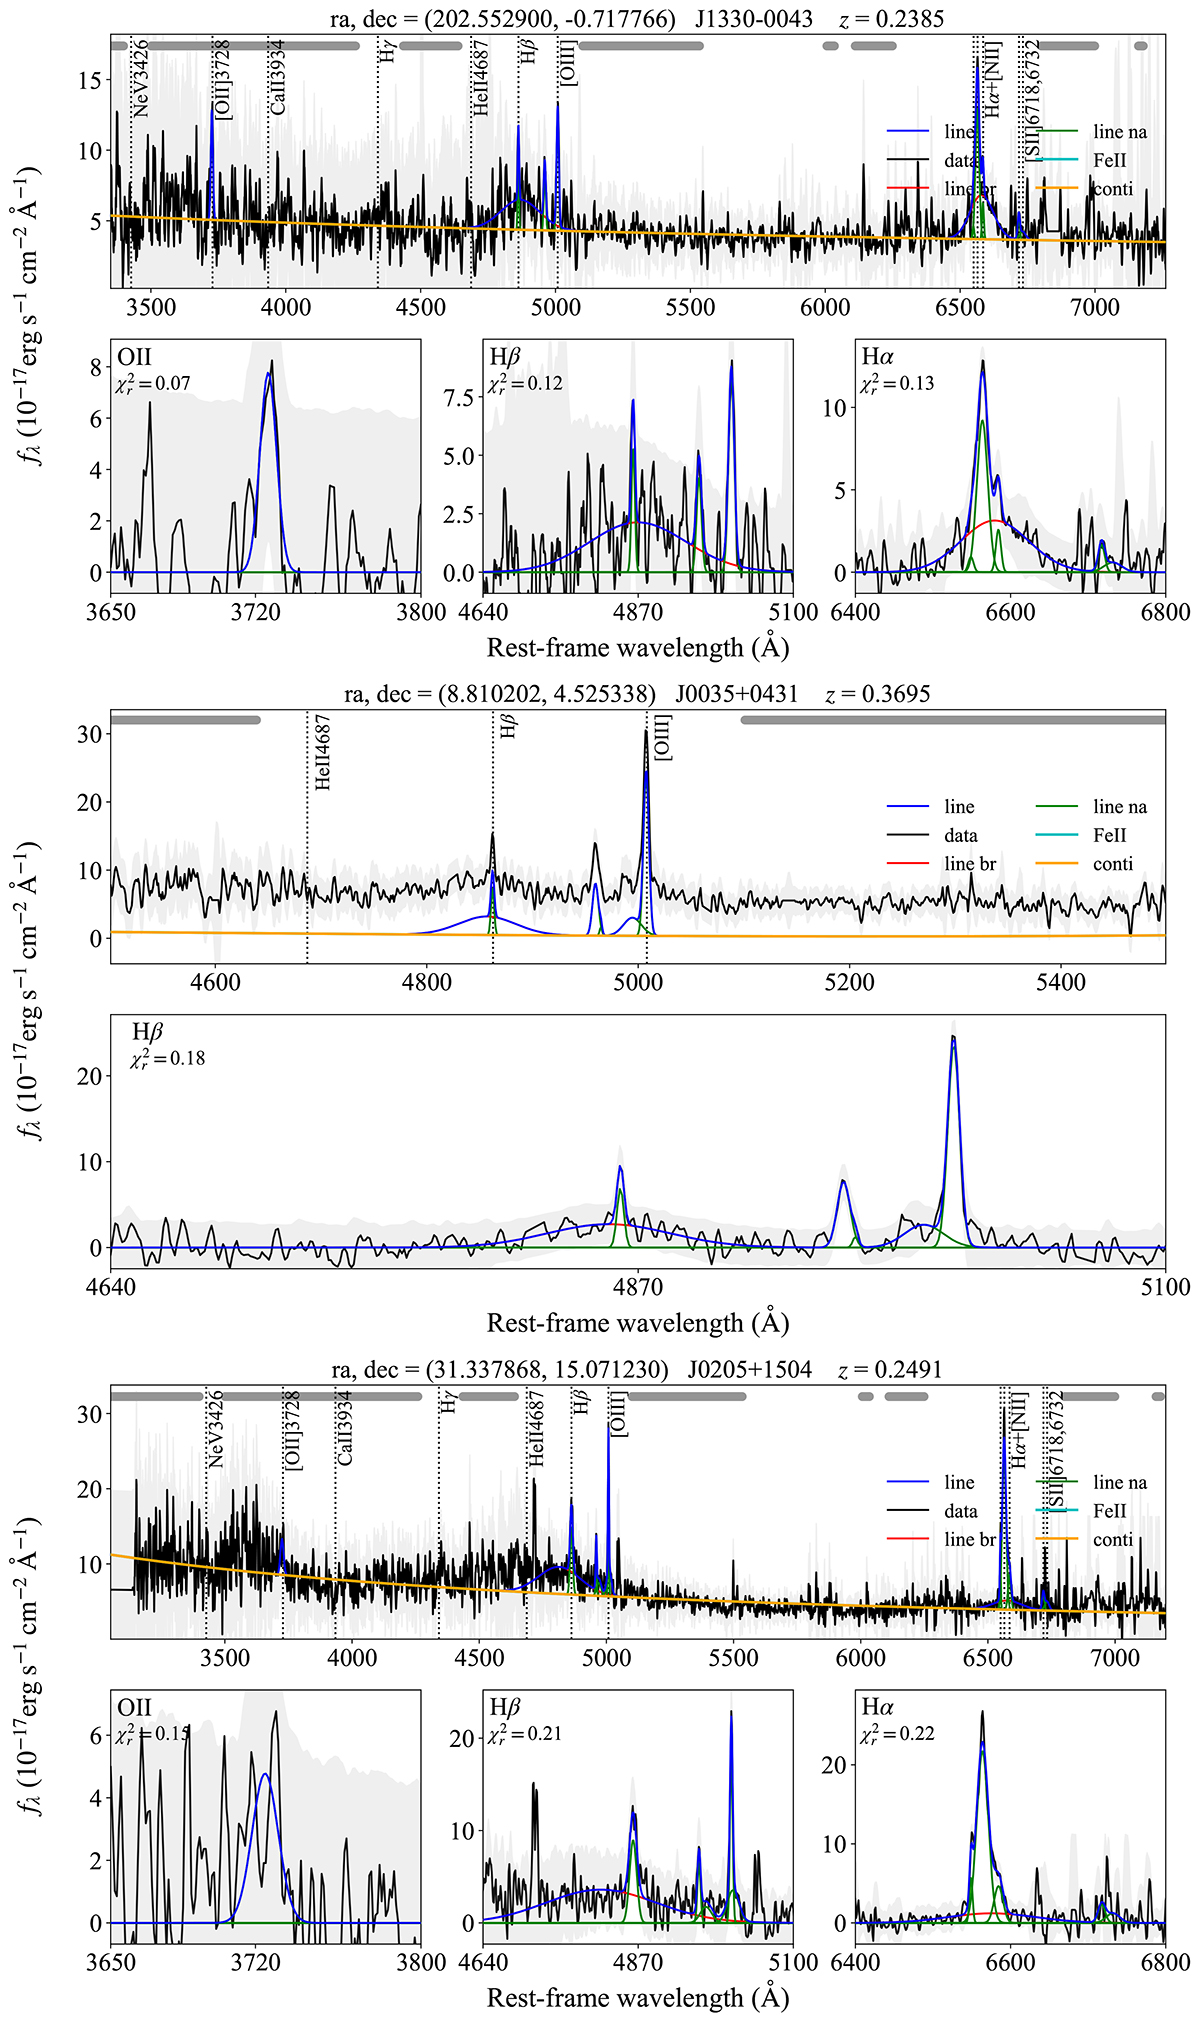
Fig. B.1.
Download original image
Spectral fitting result from QSOFITMORE. In the upper panels of the subplots, black lines denote the total de-reddened spectra (corrected for Galactic extinction from Planck Collaboration XI (2014)), yellow lines denote the continua, cyan lines depict the Fe II templates, blue lines indicate the whole emission lines, red lines represent the broad-line components, green lines denote the narrow-line components, and the gray shaded area mark the error region of the spectra. The lower panels demonstrate the zoomed-in fitting results of the different emission lines.
Current usage metrics show cumulative count of Article Views (full-text article views including HTML views, PDF and ePub downloads, according to the available data) and Abstracts Views on Vision4Press platform.
Data correspond to usage on the plateform after 2015. The current usage metrics is available 48-96 hours after online publication and is updated daily on week days.
Initial download of the metrics may take a while.