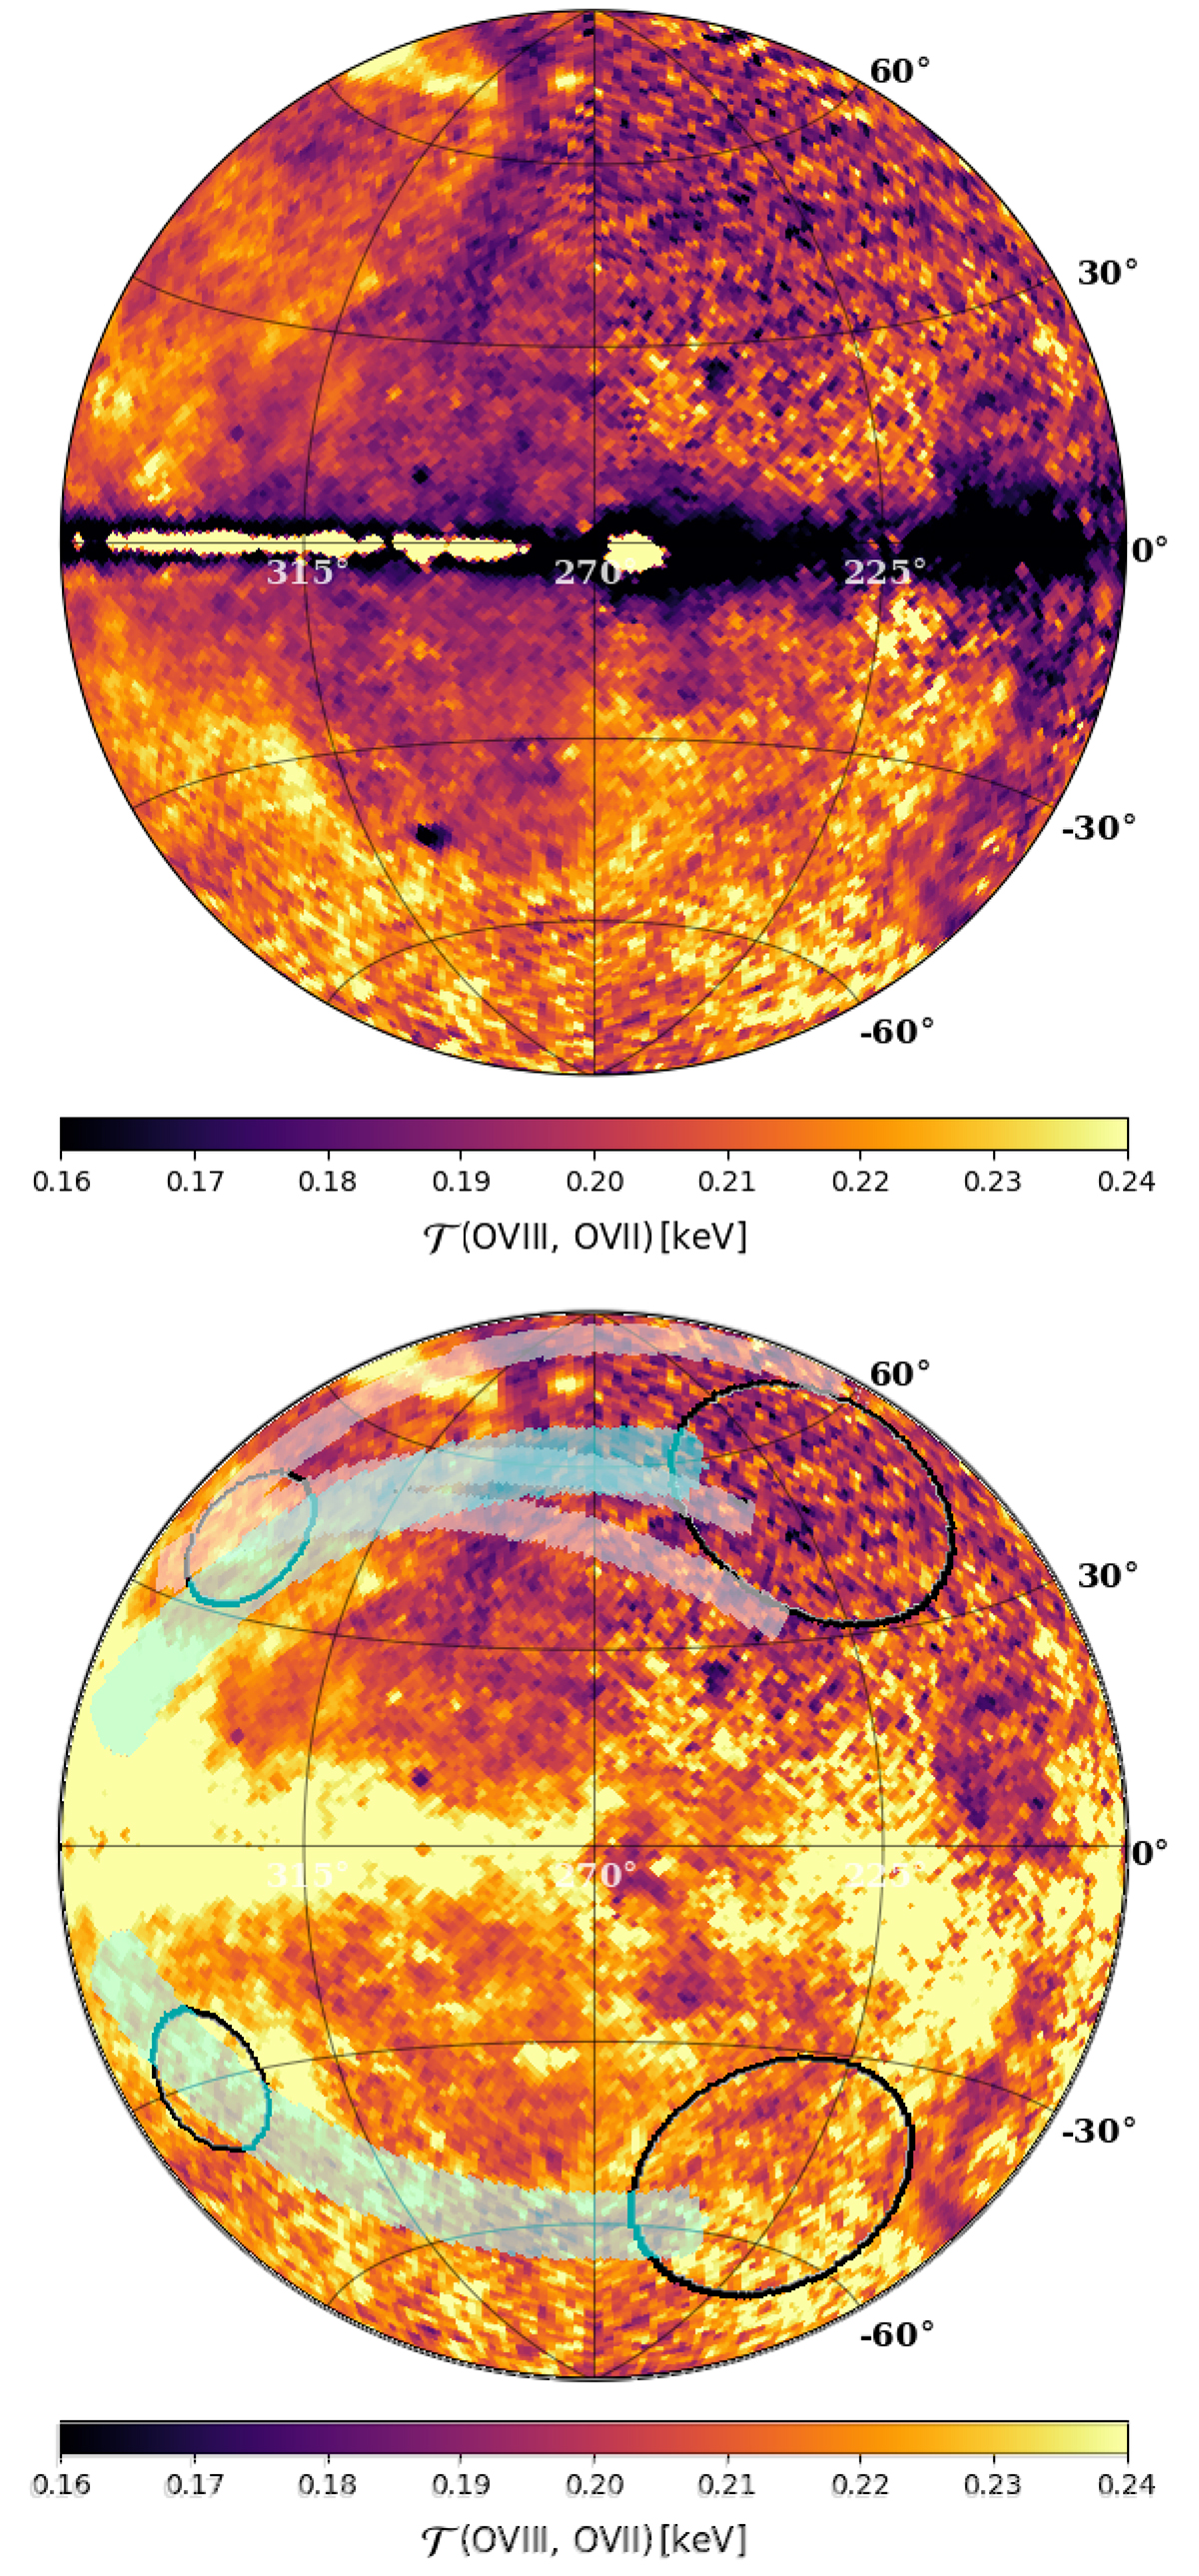
Fig. 9.
Download original image
Pseudo-temperature derived from the O lines ratio with (and without) accounting for the absorbed intensity of the line. Upper panel: Temperature map corrected for foreground absorption. This version is used for quantitative statements on the temperature throughout the paper. These maps were corrected for the LHB, CXB, SWCX, instrumental background emissions, and foreground absorption, as presented in Sect. 4 (in Fig. 7 the ratio was not corrected). The regions used for the pseudo-temperature analysis are shown in the panel below. Lower panel: Temperature map, without deabsorbing the O VII and O VIII line emission. The black circles show the regions selected for the analysis of the eROSITA bubbles and the CGM in the north and south hemispheres. The profiles shown in Figs. 12 and 13 are indicated by the transparent cyan and white regions, respectively.
Current usage metrics show cumulative count of Article Views (full-text article views including HTML views, PDF and ePub downloads, according to the available data) and Abstracts Views on Vision4Press platform.
Data correspond to usage on the plateform after 2015. The current usage metrics is available 48-96 hours after online publication and is updated daily on week days.
Initial download of the metrics may take a while.