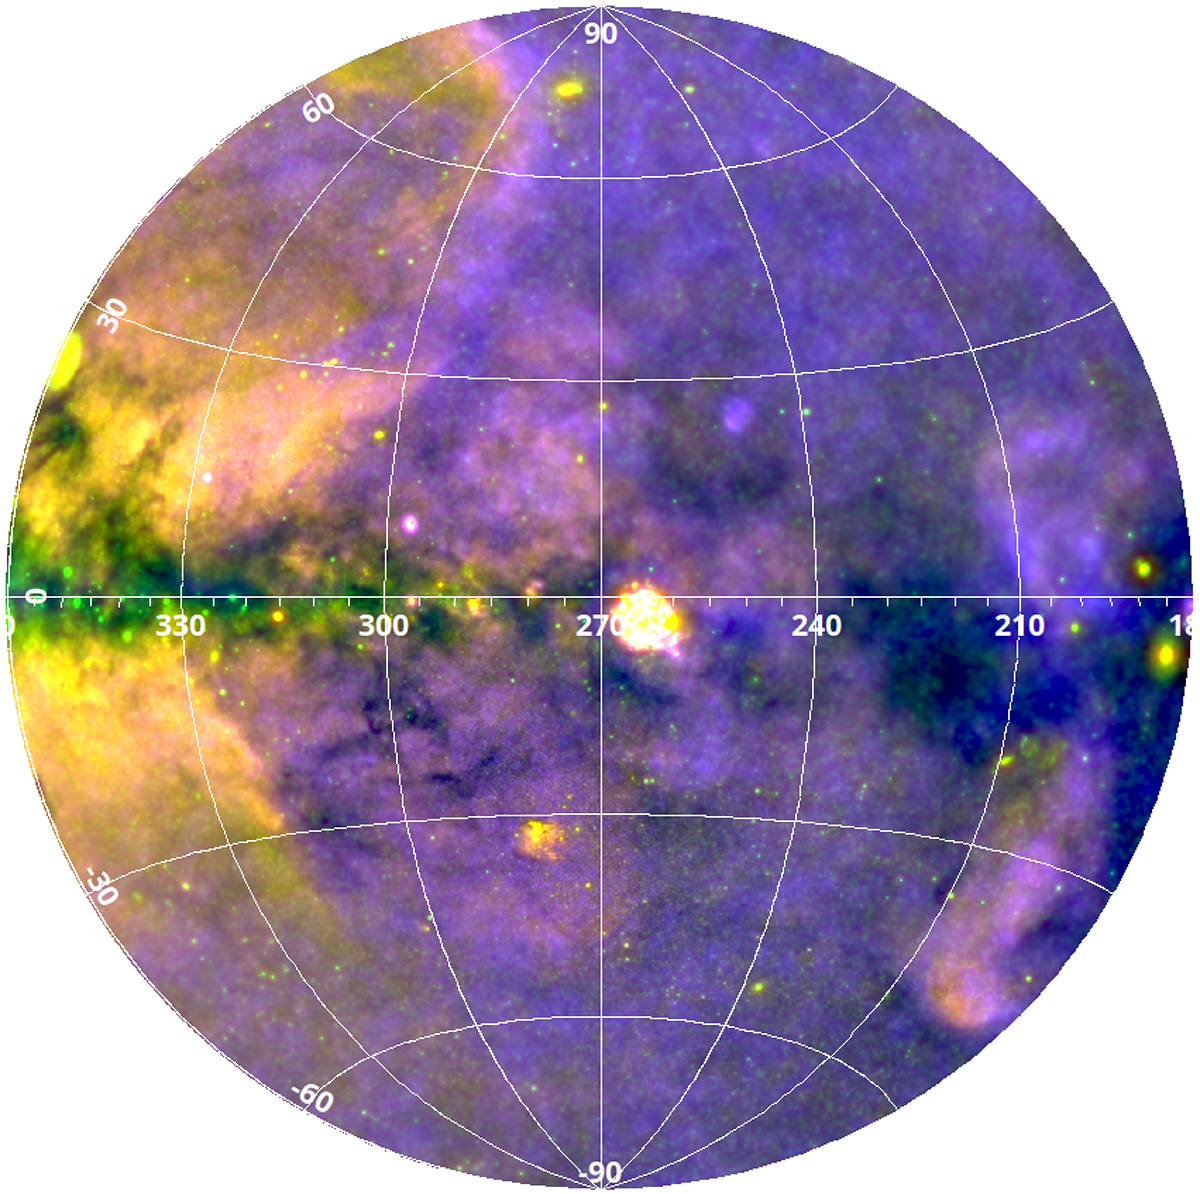
Fig. 8.
Download original image
Bright emission lines in eRASS1. The RGB map is composed of O VII (red), broadband emission in the 0.2–2.3 keV energy range (green), and the O VII/O VIII line ratio (blue). All the maps include the contribution of different components (both celestial and instrumental) and were smoothed with an adaptive kernel set to retrieve S/N threshold of 15.
Current usage metrics show cumulative count of Article Views (full-text article views including HTML views, PDF and ePub downloads, according to the available data) and Abstracts Views on Vision4Press platform.
Data correspond to usage on the plateform after 2015. The current usage metrics is available 48-96 hours after online publication and is updated daily on week days.
Initial download of the metrics may take a while.