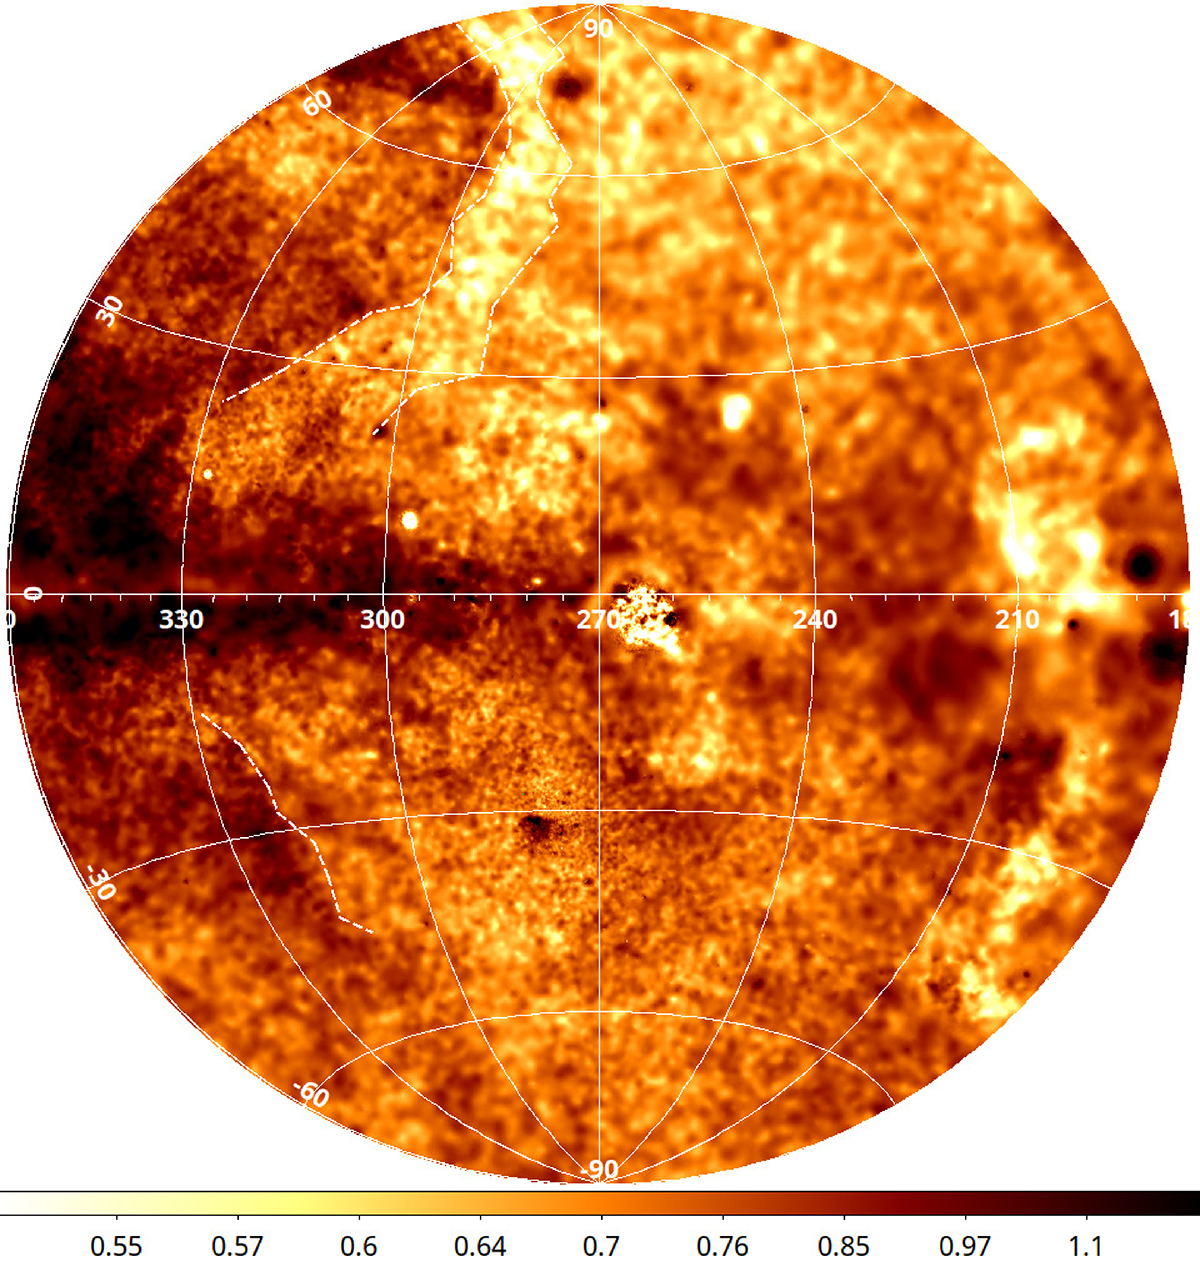
Fig. 7.
Download original image
O VIII/O VII line intensity ratio map (unitless), as observed by eROSITA during eRASS1. The contribution from CXB, LHB, foreground absorption, and instrumental background (see Sect. 4) were not removed before taking the line ratio shown in this image. An adaptive smoothing kernel using S/N = 15 was applied. The kernel used was the same for the O VII and O VIII maps. The white dashed lines are placed along the sharpest features close to the boundaries of the eROSITA bubbles.
Current usage metrics show cumulative count of Article Views (full-text article views including HTML views, PDF and ePub downloads, according to the available data) and Abstracts Views on Vision4Press platform.
Data correspond to usage on the plateform after 2015. The current usage metrics is available 48-96 hours after online publication and is updated daily on week days.
Initial download of the metrics may take a while.