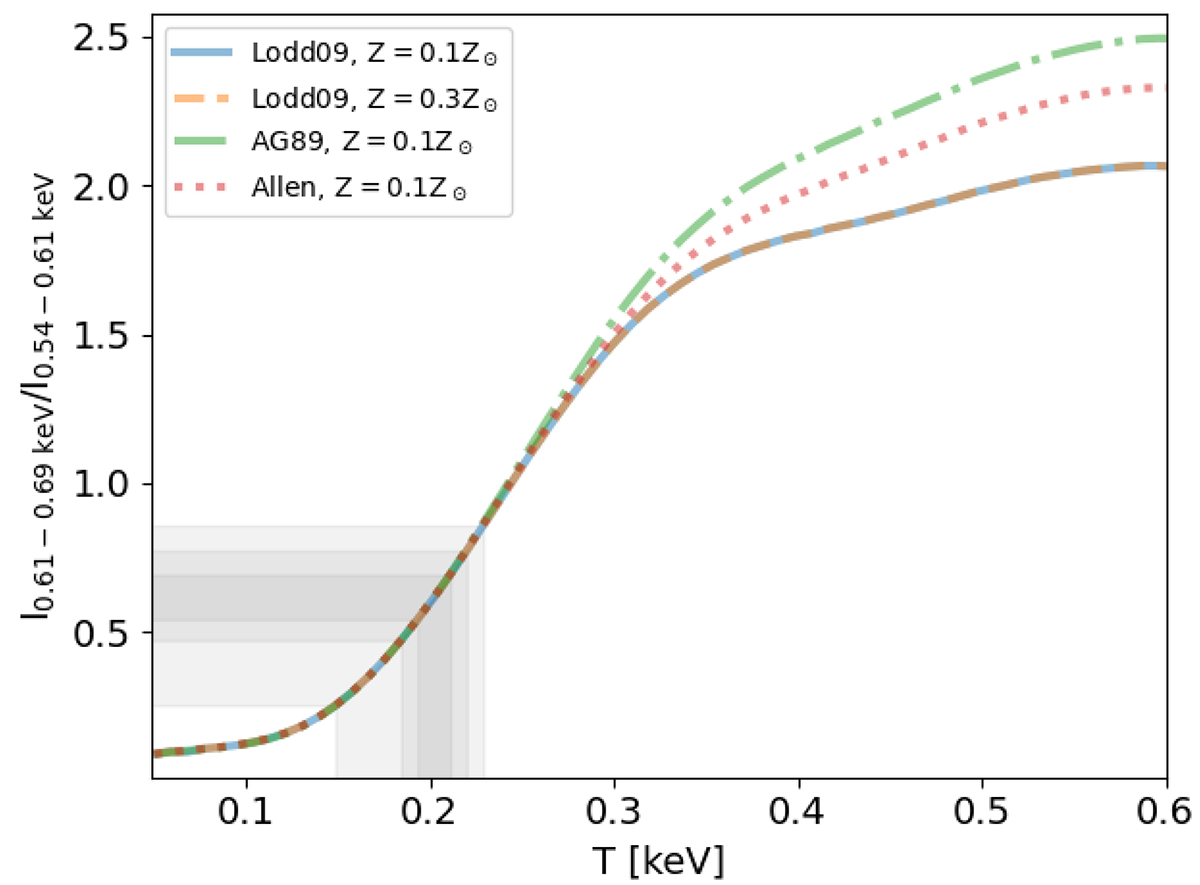
Fig. 4.
Download original image
Narrowband intensity ratio as a function of temperature, and absolute and relative metal abundances (as labeled, from AtomDB Smith et al. 2001, and convolved with the eROSITA spectral resolution). The shaded areas encompass 2, 10, 25, 75, 90, and 98% of the distribution of the narrowband intensity ratio analyzed in this work (an image of the data is presented in the top panel of Fig. 9).
Current usage metrics show cumulative count of Article Views (full-text article views including HTML views, PDF and ePub downloads, according to the available data) and Abstracts Views on Vision4Press platform.
Data correspond to usage on the plateform after 2015. The current usage metrics is available 48-96 hours after online publication and is updated daily on week days.
Initial download of the metrics may take a while.