Fig. 10.
Download original image
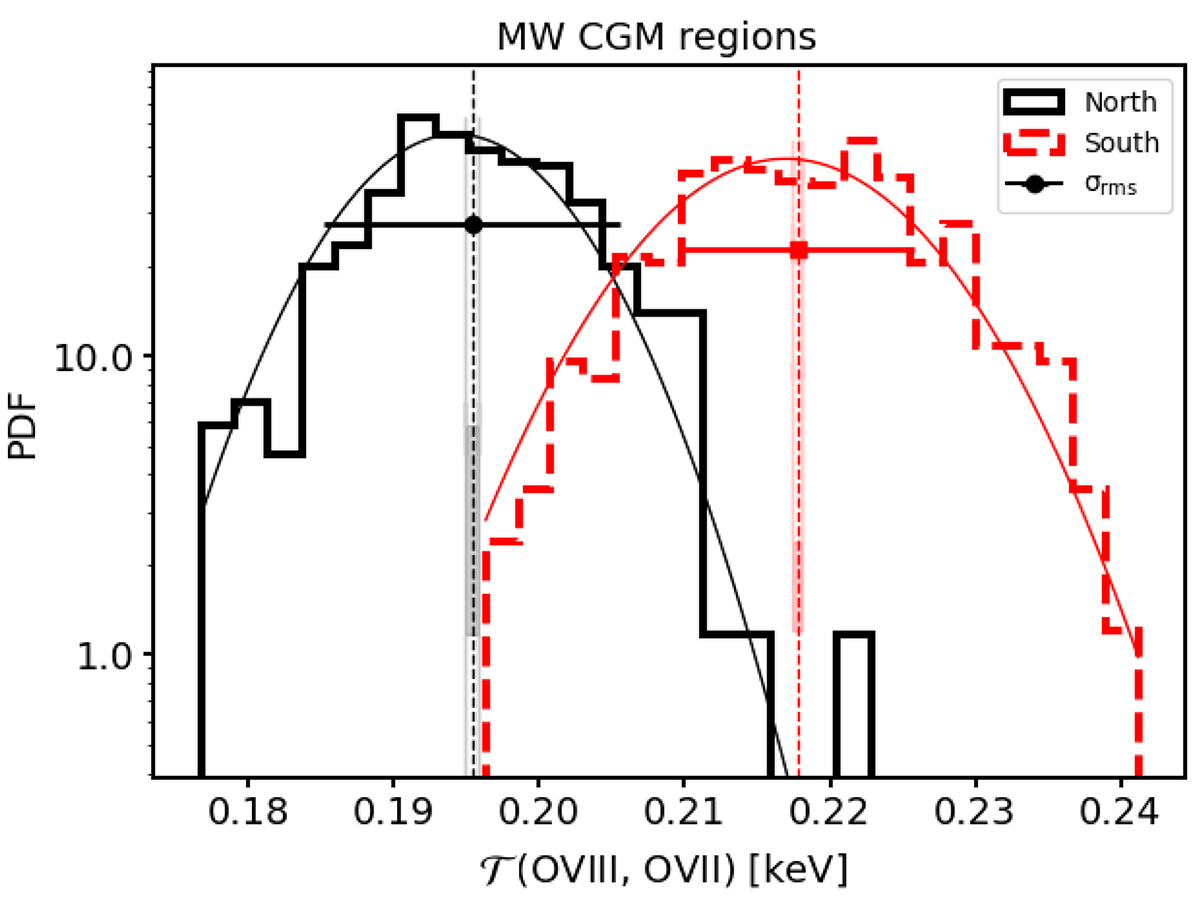
Probability distribution function (PDF) of the pseudo-temperature derived in the north and south CGM regions (black solid and red dashed lines, respectively; see footprints in the lower panel of Fig. 9). The thin solid lines show Gaussian fits of the temperature distributions. The vertical dashed lines show the median values of the distribution with the uncertainty on the mean bracketed by the filled vertical regions.
Current usage metrics show cumulative count of Article Views (full-text article views including HTML views, PDF and ePub downloads, according to the available data) and Abstracts Views on Vision4Press platform.
Data correspond to usage on the plateform after 2015. The current usage metrics is available 48-96 hours after online publication and is updated daily on week days.
Initial download of the metrics may take a while.