Fig. 1.
Download original image
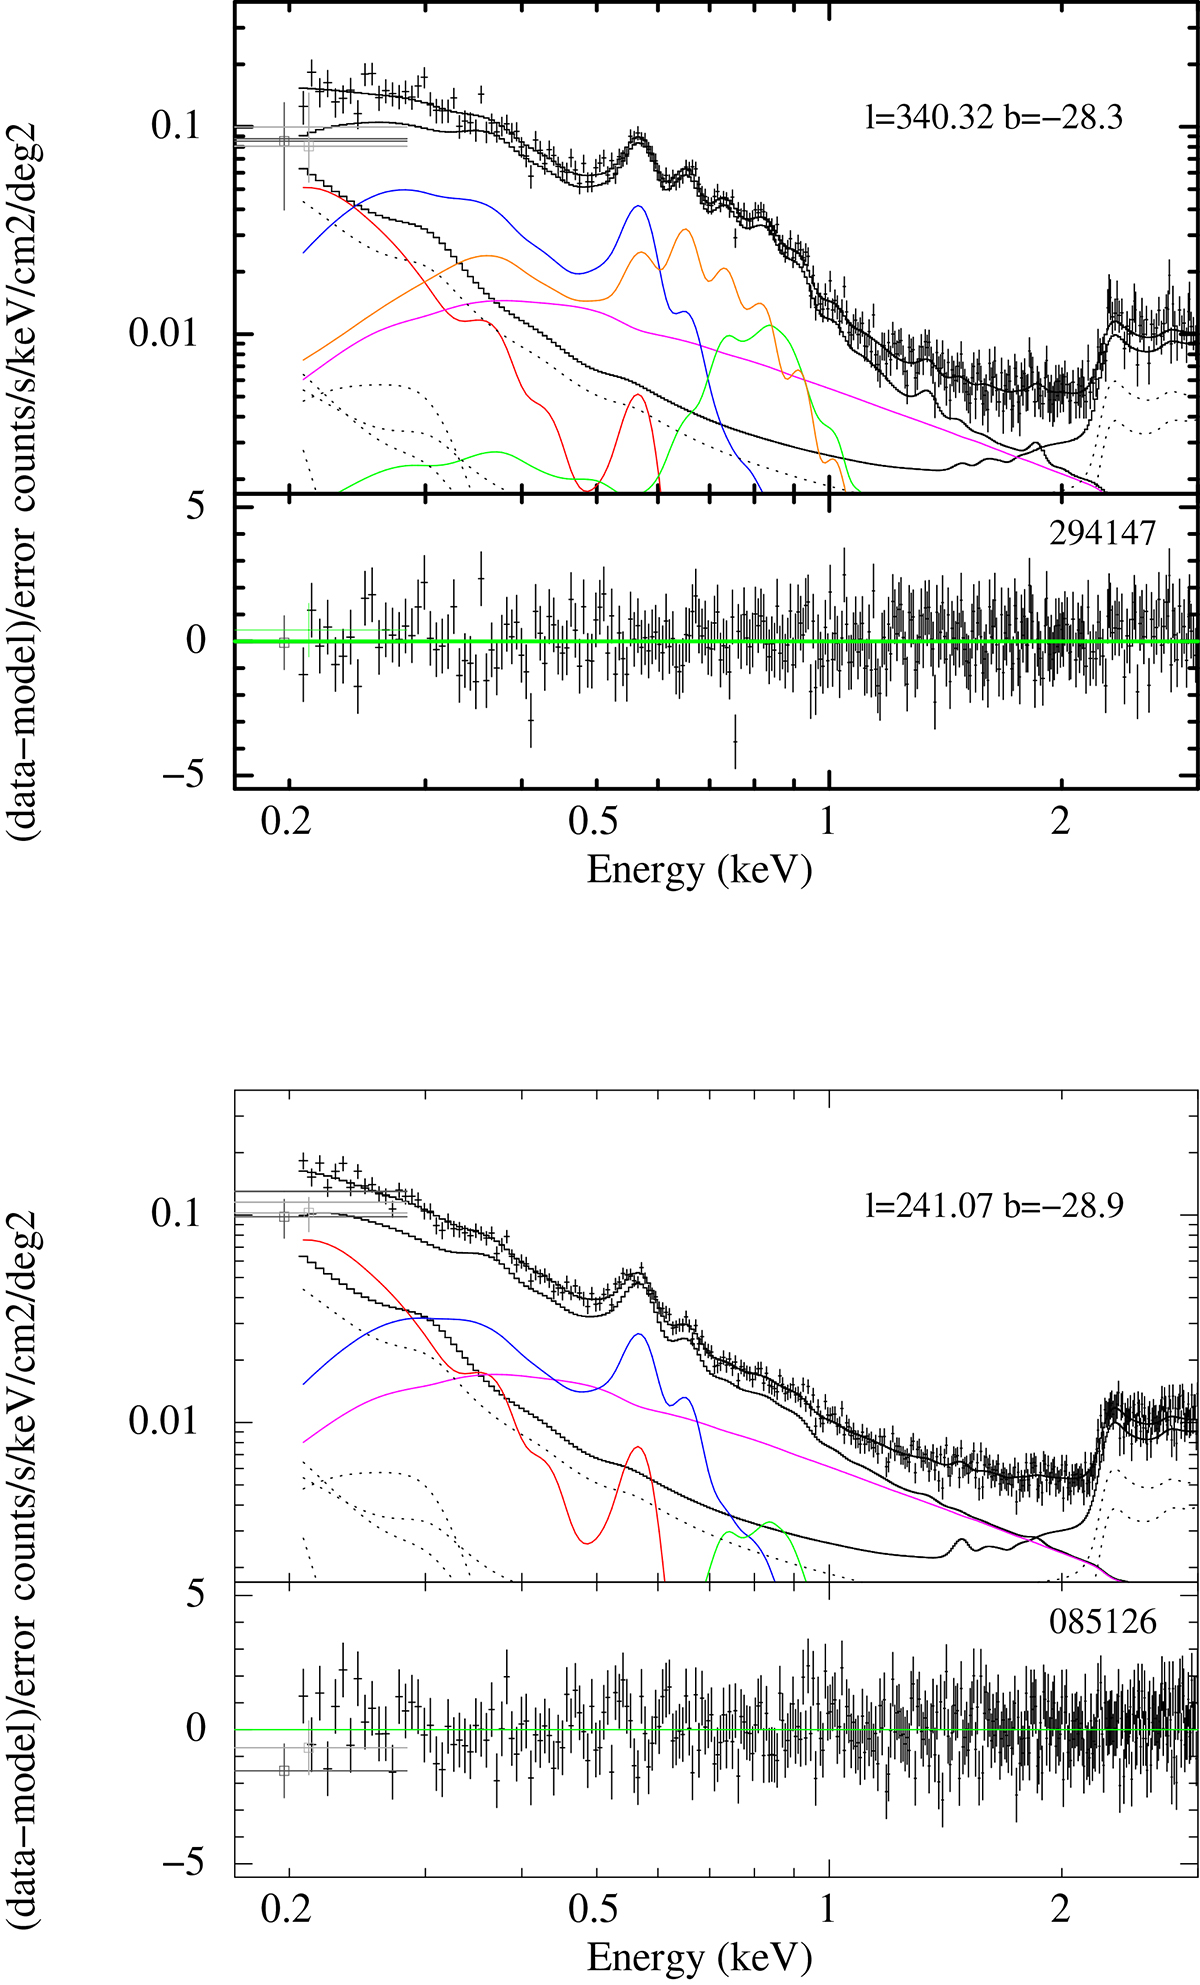
Spectra of the diffuse emission observed by eROSITA within two sky patches of 3° ×3° each. Upper panel: Observed and modeled spectrum of the sky region at ![]() ,
, ![]() (eROSITA sky tiles 294147). Lower panel: Observed and modeled spectrum of the sky region at
(eROSITA sky tiles 294147). Lower panel: Observed and modeled spectrum of the sky region at ![]() ,
, ![]() (eROSITA sky tiles 085126). The regions were chosen to show the typical diffuse emission from a patches of the sky, with (and without) the contribution from the eROSITA bubble emission. The contribution from the detected point sources has been removed. The gray dots at E = 0.2 keV show the ROSAT R1 and R2 data points. The black solid and dotted lines show the contribution of the instrumental background (derived by the fit of the filter wheel closed data). The red, blue, green, and magenta lines show the contribution of the LHB, warm-hot CGM, hot corona, and CXB emission components. The orange line (upper panel only) shows an additional plasma component that can be introduced in the eROSITA bubble region.
(eROSITA sky tiles 085126). The regions were chosen to show the typical diffuse emission from a patches of the sky, with (and without) the contribution from the eROSITA bubble emission. The contribution from the detected point sources has been removed. The gray dots at E = 0.2 keV show the ROSAT R1 and R2 data points. The black solid and dotted lines show the contribution of the instrumental background (derived by the fit of the filter wheel closed data). The red, blue, green, and magenta lines show the contribution of the LHB, warm-hot CGM, hot corona, and CXB emission components. The orange line (upper panel only) shows an additional plasma component that can be introduced in the eROSITA bubble region.
Current usage metrics show cumulative count of Article Views (full-text article views including HTML views, PDF and ePub downloads, according to the available data) and Abstracts Views on Vision4Press platform.
Data correspond to usage on the plateform after 2015. The current usage metrics is available 48-96 hours after online publication and is updated daily on week days.
Initial download of the metrics may take a while.