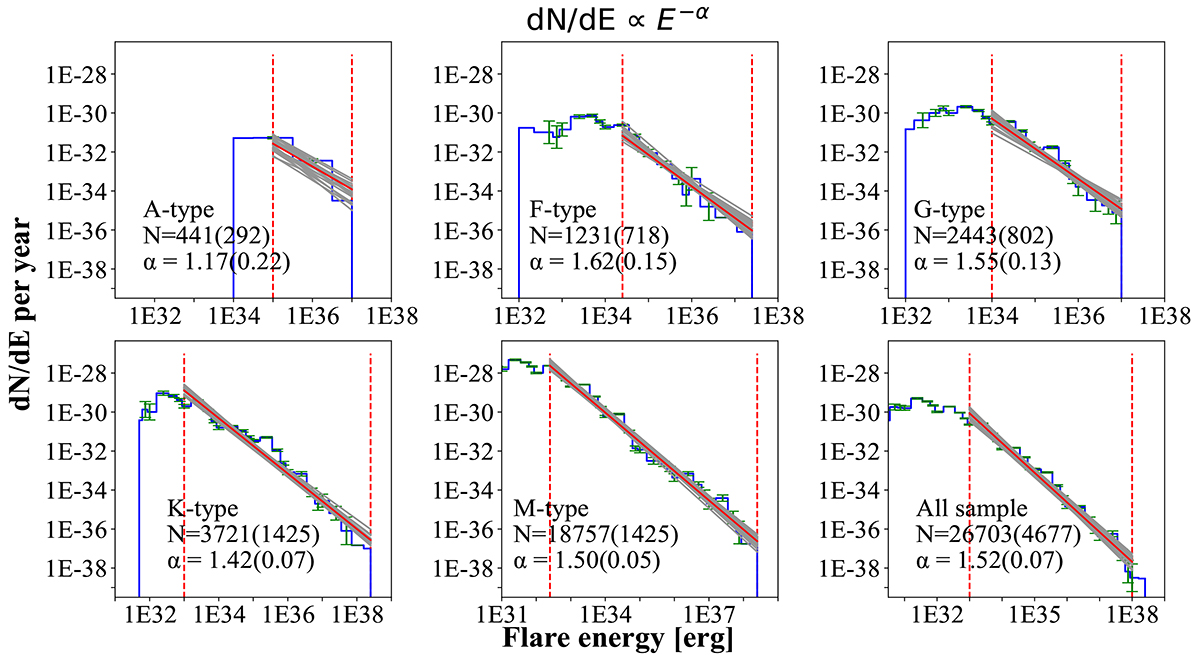
Fig. 9.

Download original image
Flare frequency distributions for different spectral types and the whole sample, demonstrating the power-law index. N represents the number of flare events of the sample, and the number of flaring stars is indicated in parentheses. The second blue vertical lines show the true end of the data, but the starting positions of the data (first blue lines) are slightly truncated. The vertical dashed red lines represent the fitting range. The gray lines are all the fitted results of the Markov chain Monte Carlo method, and the solid red line is the final result.
Current usage metrics show cumulative count of Article Views (full-text article views including HTML views, PDF and ePub downloads, according to the available data) and Abstracts Views on Vision4Press platform.
Data correspond to usage on the plateform after 2015. The current usage metrics is available 48-96 hours after online publication and is updated daily on week days.
Initial download of the metrics may take a while.


