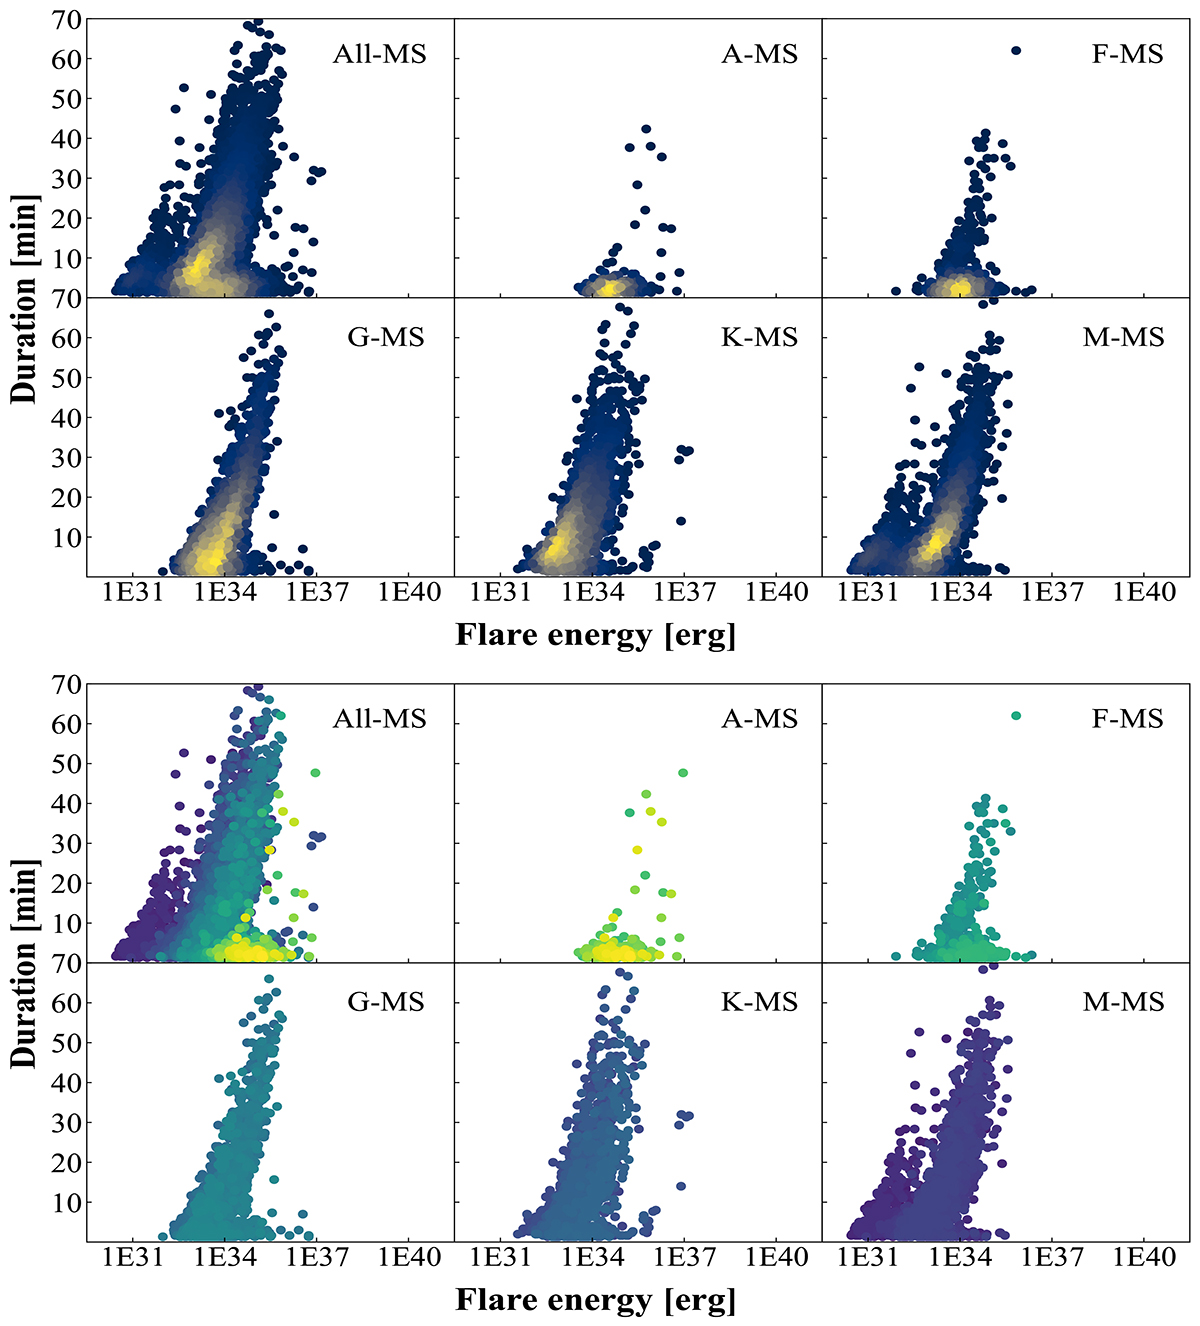
Fig. 7.
Download original image
Relationships between flare energy and duration for samples of different spectral types. Upper panel: density of points in different regions (brighter colors indicate a higher number of points). Lower panel: flaring star’s temperature. Note that we have sorted the data by temperature, with points with higher temperatures plotted higher up in the graph.
Current usage metrics show cumulative count of Article Views (full-text article views including HTML views, PDF and ePub downloads, according to the available data) and Abstracts Views on Vision4Press platform.
Data correspond to usage on the plateform after 2015. The current usage metrics is available 48-96 hours after online publication and is updated daily on week days.
Initial download of the metrics may take a while.