Open Access
Fig. 4.
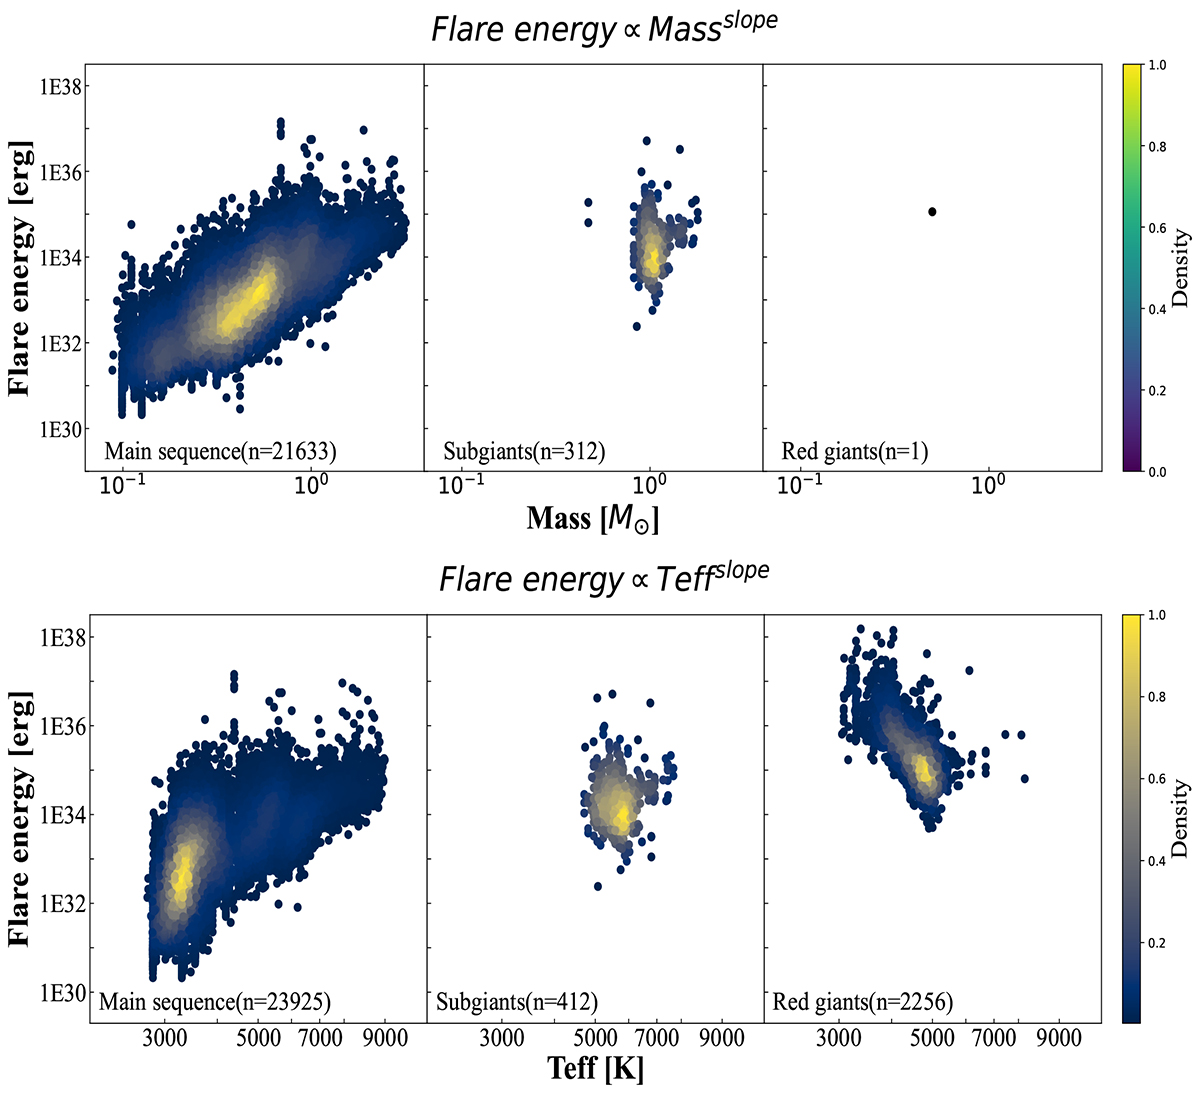
Download original image
Relationships between the flare energy and the stellar mass (top) and stellar temperature (bottom). We have separated our samples into three evolution stages (main sequence stars, subgiants, and red giants). The n represents the number of points in the panel.
Current usage metrics show cumulative count of Article Views (full-text article views including HTML views, PDF and ePub downloads, according to the available data) and Abstracts Views on Vision4Press platform.
Data correspond to usage on the plateform after 2015. The current usage metrics is available 48-96 hours after online publication and is updated daily on week days.
Initial download of the metrics may take a while.